Synergies is a cognitive application service provider that combines business knowledge, artificial intelligence technology, and software development. Their mission is to help businesses through their digital transformation journey, become leaders and innovators in their industries by unlocking the power of data in the hands of business users and decision makers. Their product, JarviX, is an AnalyticOps Platform . JarviX uses NLP…
N/A
Microsoft BI (MSBI)
Score 8.7 out of 10
N/A
Microsoft BI is a business intelligence product used for data analysis and generating reports on server-based data. It features unlimited data analysis capacity with its reporting engine, SQL Server Reporting Services alongside ETL, master data management, and data cleansing.
$14
per month per user
Pricing
JarviX
Microsoft BI (MSBI)
Editions & Modules
No answers on this topic
Power BI Pro
$14
per month per user
Power BI Premium
$24
per month per user
Offerings
Pricing Offerings
JarviX
Microsoft BI (MSBI)
Free Trial
No
No
Free/Freemium Version
No
Yes
Premium Consulting/Integration Services
No
No
Entry-level Setup Fee
No setup fee
No setup fee
Additional Details
—
—
More Pricing Information
Community Pulse
JarviX
Microsoft BI (MSBI)
Features
JarviX
Microsoft BI (MSBI)
BI Standard Reporting
Comparison of BI Standard Reporting features of Product A and Product B
JarviX
7.6
2 Ratings
7% below category average
Microsoft BI (MSBI)
9.0
53 Ratings
10% above category average
Pixel Perfect reports
8.21 Ratings
8.546 Ratings
Customizable dashboards
7.32 Ratings
9.653 Ratings
Report Formatting Templates
7.31 Ratings
9.051 Ratings
Ad-hoc Reporting
Comparison of Ad-hoc Reporting features of Product A and Product B
JarviX
7.8
2 Ratings
3% below category average
Microsoft BI (MSBI)
8.6
53 Ratings
7% above category average
Drill-down analysis
7.12 Ratings
8.548 Ratings
Formatting capabilities
7.31 Ratings
8.353 Ratings
Integration with R or other statistical packages
9.11 Ratings
8.442 Ratings
Report sharing and collaboration
7.72 Ratings
9.053 Ratings
Report Output and Scheduling
Comparison of Report Output and Scheduling features of Product A and Product B
JarviX
7.8
1 Ratings
5% below category average
Microsoft BI (MSBI)
8.6
52 Ratings
5% above category average
Publish to Web
9.11 Ratings
9.448 Ratings
Publish to PDF
7.31 Ratings
9.248 Ratings
Report Versioning
6.41 Ratings
7.544 Ratings
Report Delivery Scheduling
8.21 Ratings
8.547 Ratings
Delivery to Remote Servers
8.21 Ratings
8.626 Ratings
Data Discovery and Visualization
Comparison of Data Discovery and Visualization features of Product A and Product B
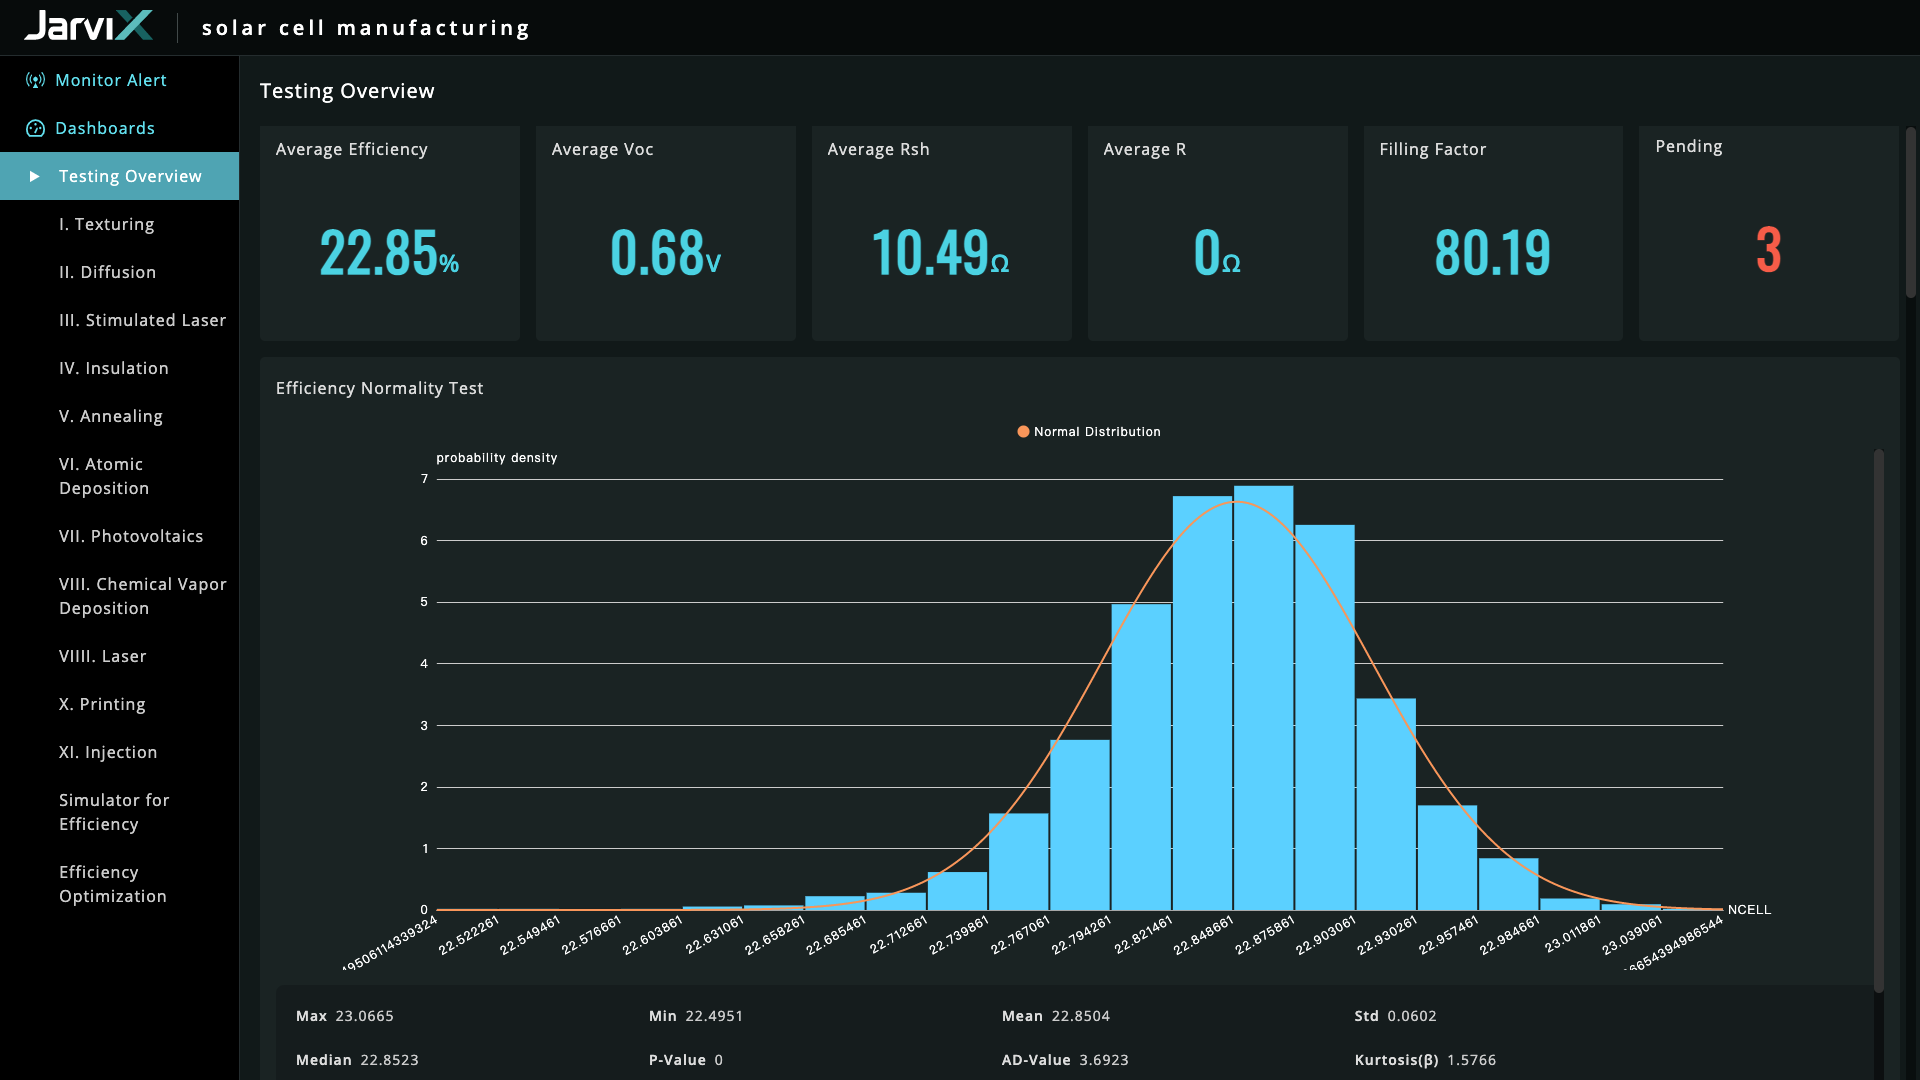
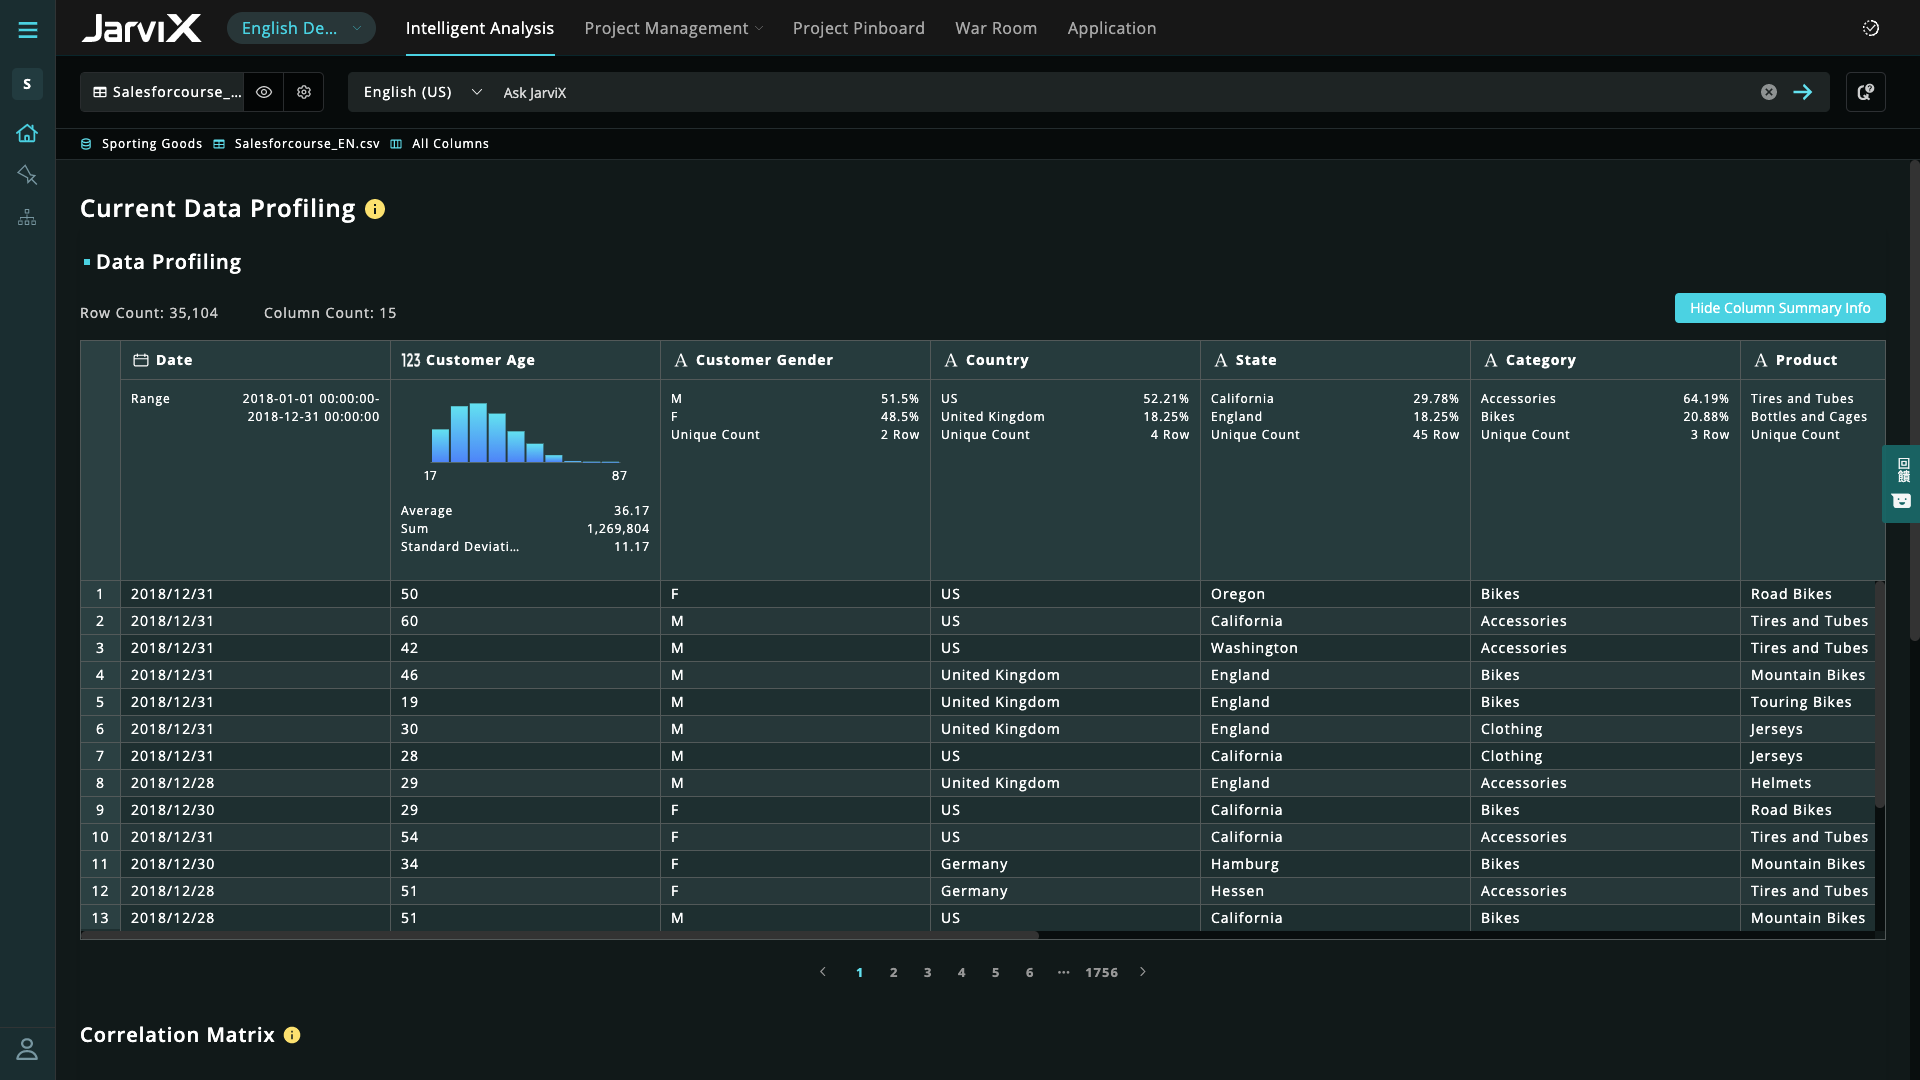
JarviX is very good at data integration, creating charts and reports for data visualization. It is really impressive that Jarvix can let our marketing team know the number of members living in a specific area in seconds. In addition, the product manager from Synergies is willing to help us with all problems we encounter. I accidentally changed one of the settings in a data table which threw the existing dashboard into chaos. However, after assistance from the product manager, we were able to successfully bring the data back to normal.
Microsoft BI has a lot of features and is a very powerful tool, especially if you have folks on your team that know how to utilize all of its capabilities. To truly unlock all that it can do, it does require people to have a deep understanding of its capabilities. That's where the software really shines. If you are looking for a simpler, more basic reporting tool, there are other programs available that do not require such a steep learning curve.
There should be more flexibility in changing the data tables uploaded into JarviX. For example, it should enable users to edit the syntax of the table or change the data format of the columns without affecting the existing dashboard and charts already created using that data table.
Microsoft BI is fundamental to our suite of BI applications. That being said, Northcraft Analytics is focused on delighting our customers, so if the underlying factors of our decision change, we would choose to re-write our BI applications on a different stack. Luckily, mathematics are the fundamental IP of our technology... and is portable across all BI platforms for the foreseeable future.
The Microsoft BI tools have great usability for both developers and end users alike. For developers familiar with Visual Studio, there is little learning curve. For those not, the single Visual Studio IDE means not having to learn separate tools for each component. For end-users, the web interface for SSRS is simple to navigate with intuitive controls. For ad-hoc analysis, Excel can connect directly to SSAS and provide a pivot table like experience which is familiar to many users. For database development, there is beginning to be some confusion, as there are now three tool choices (VS, SSMS, Azure Data Studio) for developers. I would like to see Azure Data Studio become the superset of SSMS and eventually supplant it.
SQL Server Reporting Services (SSRS) can drag at times. We created two report servers and placed them under an F5 load balancer. This configuration has worked well. We have seen sluggish performance at times due to the Windows Firewall.
MSBI natively has a site that allows you to vote on user enhancements and bug fixes. This allows the largest nagging issues to float to the top and the development team can prioritize accordingly. As mentioned earlier, the large community base of MSBI developers assist technical resources in handling technical questions.
I have used on-line training from Microsoft and from Pragmatic Works. I would recommend Pragmatic Works as the best way to get up to speed quickly, and then use the Microsoft on-line training to deep dive into specific features that you need to get depth with.
We are a consulting firm and as such our best resources are always billing on client projects. Our internal implementation has weaknesses, but that's true for any company like ours. My rating is based on the product's ease of implementation.
Tableau and Power BI. Obviously, they are not in the same category. Tableau and Power BI only provide data visualizations plus a little bit of analytics. JarviX not only provides data exploration, so you can find out what the problem is, as well as model management and App builder. If you only look for a dashboard, yes BI is probably enough, but if you constantly feel lacking actionable insights for actual implementations of improvements, JarviX is the choice for you.
We have used the built in ConnectWise Manager reports and custom reports. The reports provide static data. PowerBI shows us live data we can drill down into and easily adjust parameters. It's much more useful than a static PDF report.
I think the best part of JarviX is that we can get the analysis results in several minutes. We spent lots of time making reports and managing our data in the past. All in all, it helps us save the time, cost, and labor of managing data.
As a SaaS provider we see being able to provide self-service BI to our client users as a competitive advantage. In fact the MSSQL enabled BI is a contributing factor to many winning RFPs we have done for prospective client organisations.
However MSSQL BI requires extensive knowledge and skills to design and develop data warehouses & data models as a foundation to support business analysts and users to interrogate data effectively and efficiently. Often times we find having strong in-house MSSQL expertise is a bless.