Synergies is a cognitive application service provider that combines business knowledge, artificial intelligence technology, and software development. Their mission is to help businesses through their digital transformation journey, become leaders and innovators in their industries by unlocking the power of data in the hands of business users and decision makers. Their product, JarviX, is an AnalyticOps Platform . JarviX uses NLP…
N/A
Zendesk Explore
Score 8.3 out of 10
N/A
Zendesk offers Explore, a business intelligence and customer analytics tool which integrates with the Zendesk suite featuring ticket analytics, custom fields, dashboards, and other features. Zendesk is migrating customers of the BIME analytics product, which is approaching end of support, to Zendesk Explore in 2019.
N/A
Pricing
JarviX
Zendesk Explore
Editions & Modules
No answers on this topic
No answers on this topic
Offerings
Pricing Offerings
JarviX
Zendesk Explore
Free Trial
No
No
Free/Freemium Version
No
No
Premium Consulting/Integration Services
No
No
Entry-level Setup Fee
No setup fee
No setup fee
Additional Details
—
—
More Pricing Information
Community Pulse
JarviX
Zendesk Explore
Features
JarviX
Zendesk Explore
BI Standard Reporting
Comparison of BI Standard Reporting features of Product A and Product B
JarviX
7.6
2 Ratings
7% below category average
Zendesk Explore
9.0
10 Ratings
9% above category average
Pixel Perfect reports
8.21 Ratings
7.96 Ratings
Customizable dashboards
7.32 Ratings
9.110 Ratings
Report Formatting Templates
7.31 Ratings
9.97 Ratings
Ad-hoc Reporting
Comparison of Ad-hoc Reporting features of Product A and Product B
JarviX
7.8
2 Ratings
3% below category average
Zendesk Explore
6.8
10 Ratings
16% below category average
Drill-down analysis
7.12 Ratings
10.010 Ratings
Formatting capabilities
7.31 Ratings
5.310 Ratings
Integration with R or other statistical packages
9.11 Ratings
4.85 Ratings
Report sharing and collaboration
7.72 Ratings
7.210 Ratings
Report Output and Scheduling
Comparison of Report Output and Scheduling features of Product A and Product B
JarviX
7.8
1 Ratings
5% below category average
Zendesk Explore
7.8
10 Ratings
5% below category average
Publish to Web
9.11 Ratings
6.96 Ratings
Publish to PDF
7.31 Ratings
6.18 Ratings
Report Versioning
6.41 Ratings
9.03 Ratings
Report Delivery Scheduling
8.21 Ratings
8.97 Ratings
Delivery to Remote Servers
8.21 Ratings
8.14 Ratings
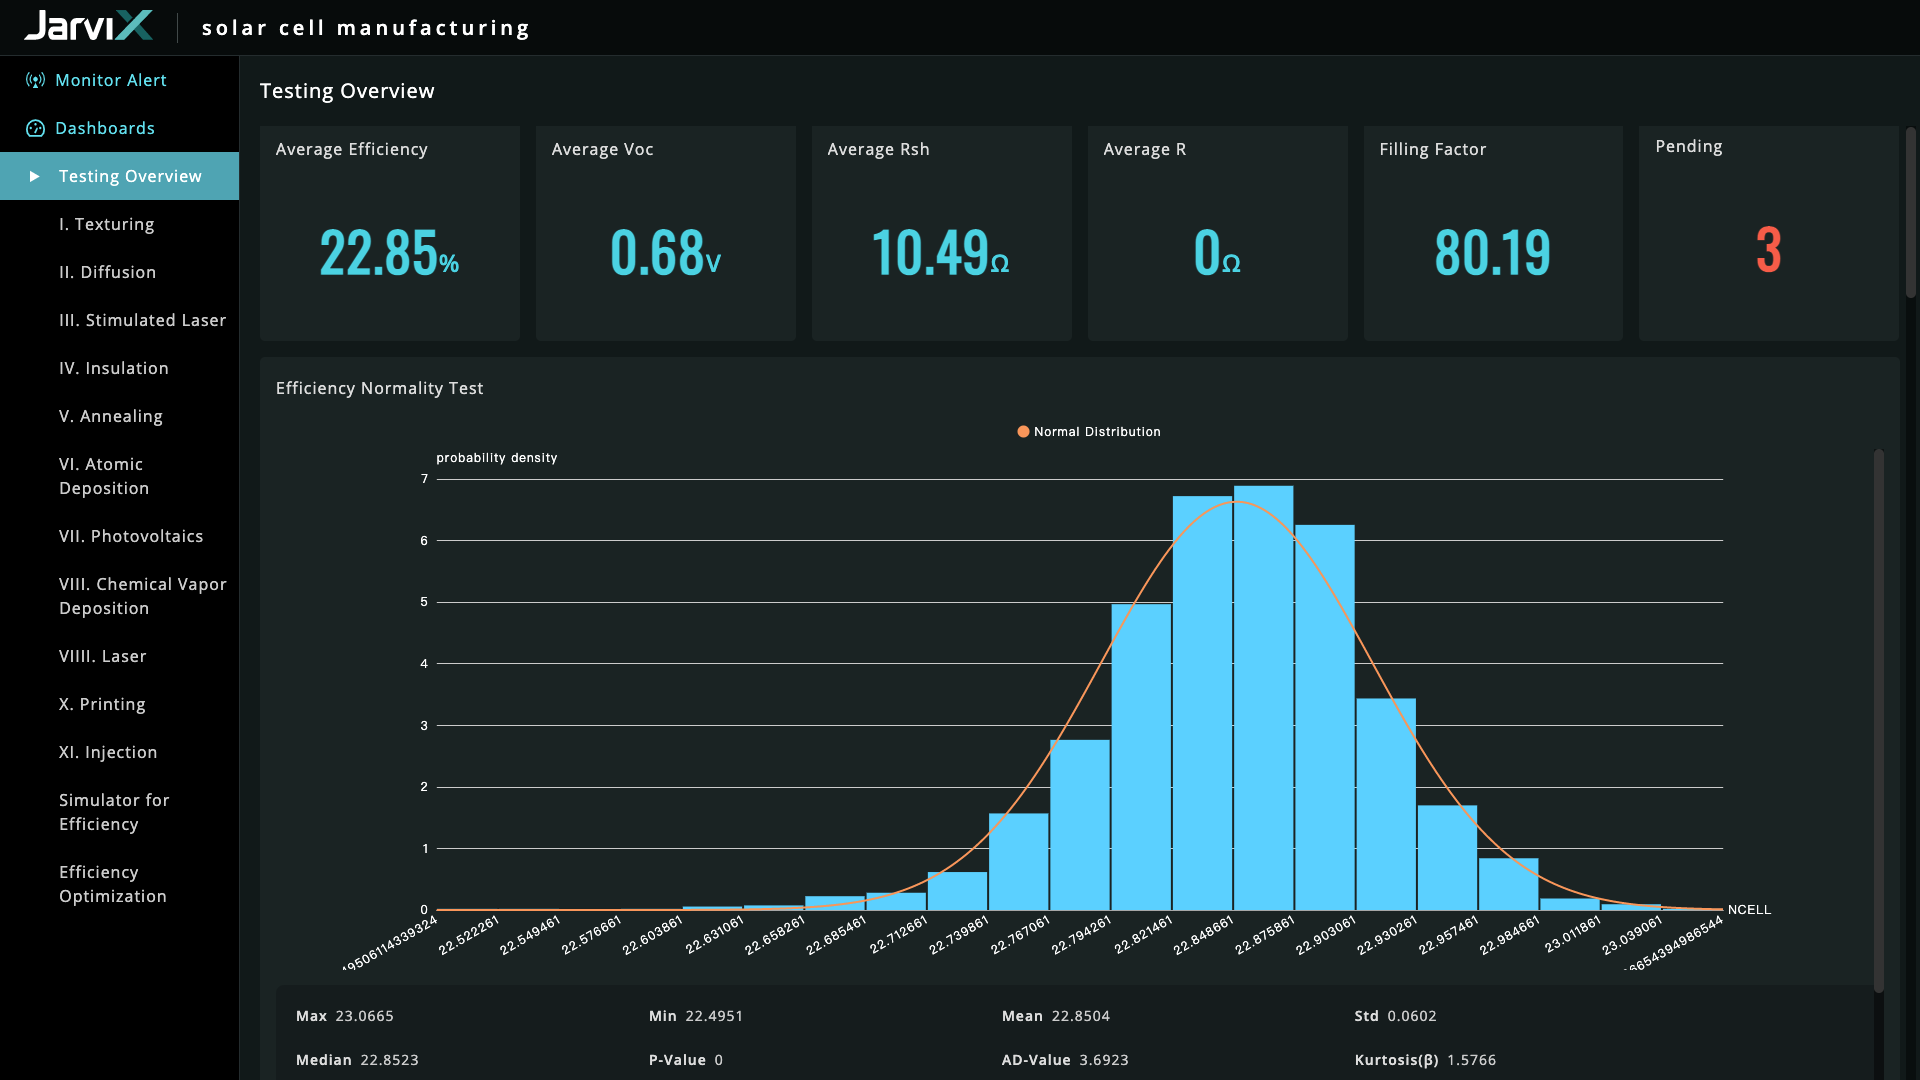
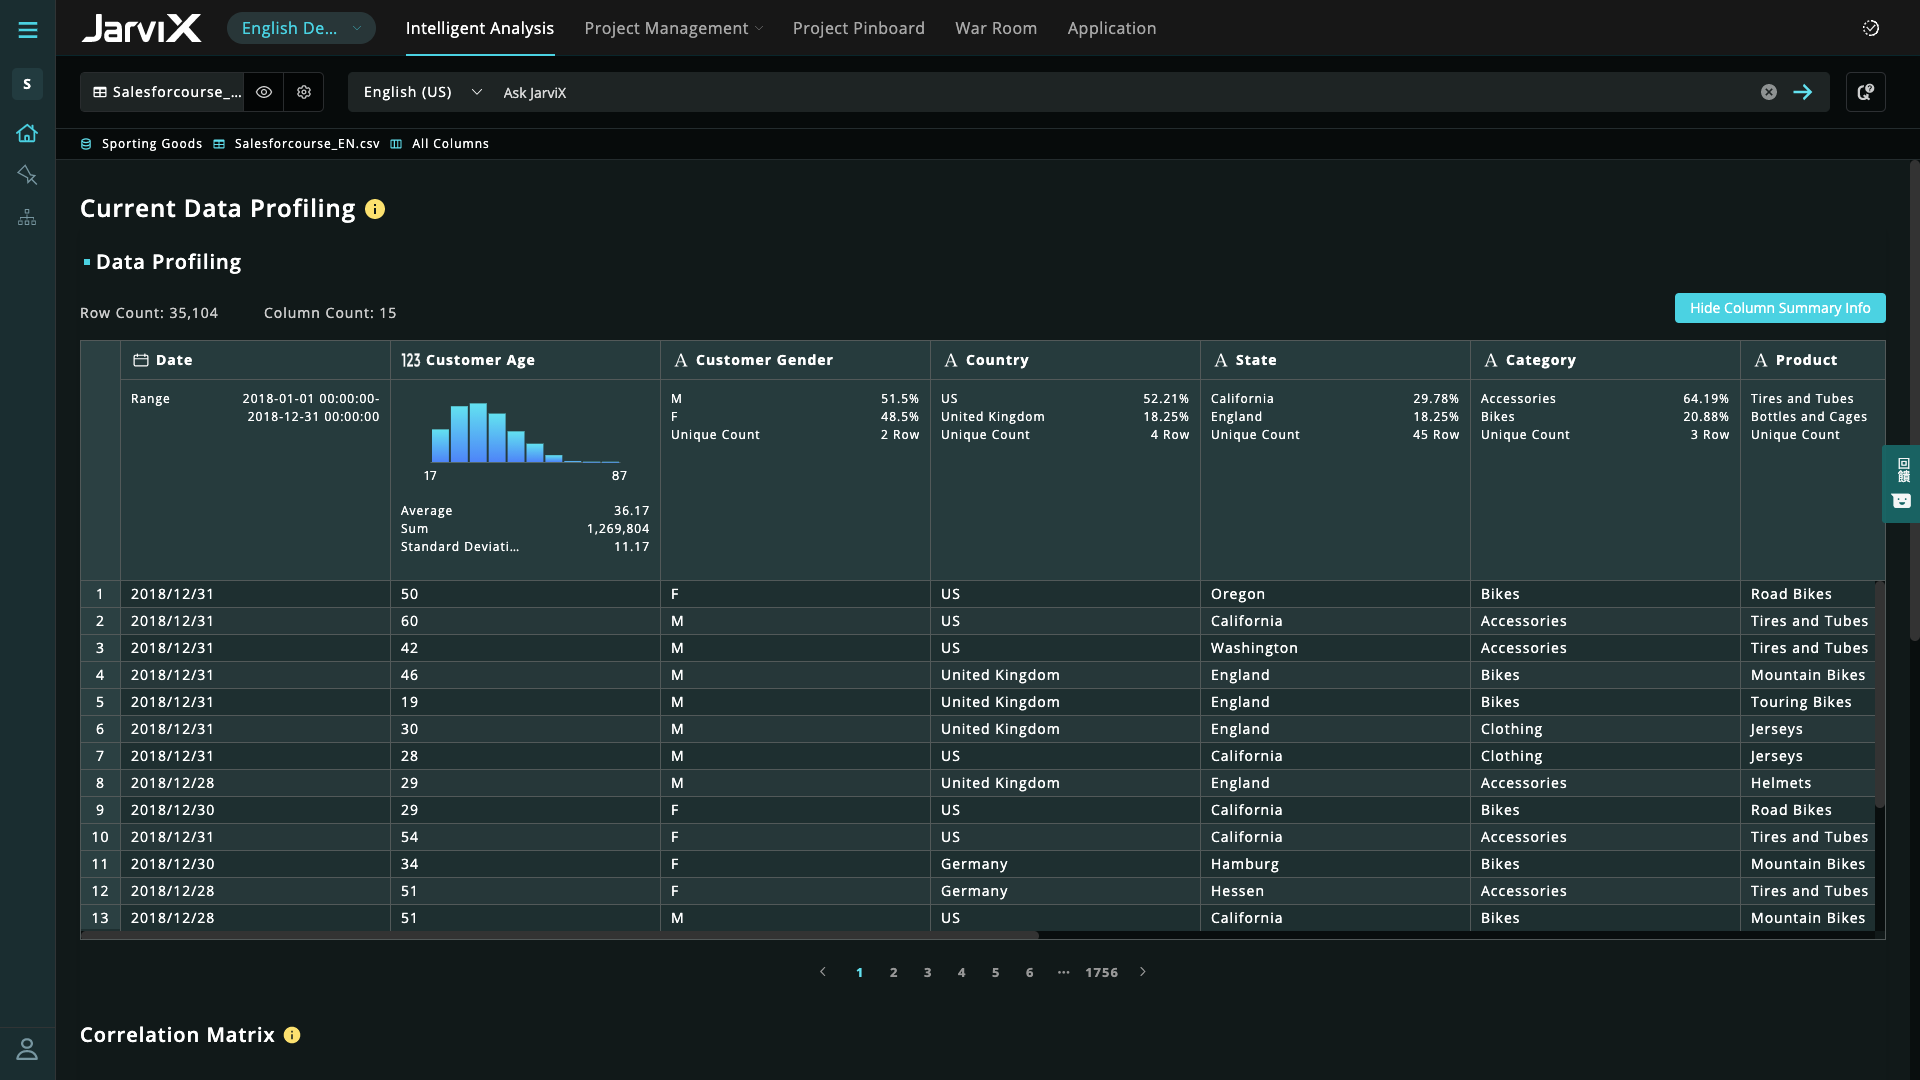
Data Discovery and Visualization
Comparison of Data Discovery and Visualization features of Product A and Product B
JarviX is very good at data integration, creating charts and reports for data visualization. It is really impressive that Jarvix can let our marketing team know the number of members living in a specific area in seconds. In addition, the product manager from Synergies is willing to help us with all problems we encounter. I accidentally changed one of the settings in a data table which threw the existing dashboard into chaos. However, after assistance from the product manager, we were able to successfully bring the data back to normal.
Zendesk Explore is well suited for tracking ticket flow, agent performance, and customer satisfaction providing valuable insights into response and resolution time, workload and support quality. Particularly useful for monitoring ticket handling for different teams. Helps ensure accountability by tracking how long tickets remain assigned before being reassigned to another group. Drill down capability helps identify support bottlenecks. However, it is less appropriate for real time monitoring as it lacks real time data updates making it unsuitable for instant decision making.
There should be more flexibility in changing the data tables uploaded into JarviX. For example, it should enable users to edit the syntax of the table or change the data format of the columns without affecting the existing dashboard and charts already created using that data table.
Some aspects of Zendesk, in general, are not super intuitive. The same goes for Zendesk Explore. And, while you can google answers and hope you find something helpful, there isn't a great way to learn to get the full potential out of the product unless you want to pay for someone from your team to take a class (which costs several hundred dollars).
To piggyback off the last point, if you would prefer to get help from a Zendesk expert, you'll find that there is almost no customer support available to you. For a company that aims to help other companies help their customers, this has always struck me as odd. Again, Google is your friend and beyond that, you're mostly out of luck.
I rate Zendesk Explore 8 out of 10 for it's overall usability because it offers powerful reporting and analytics with an easy to navigate interface and intuitive dashboards. It helps improve customer satisfaction by providing valuable insights into ticket handling, agent performance and customer satisfaction. Though the complex query builder can be challenging for non technical users.
Support for all of Zendesk has exceeding my expectations. This company will always get a 10 out of 10 in my book. Any question you have they make sure you have the answer plus a step-by-step guide on how to do each step so you are set up for success!
Tableau and Power BI. Obviously, they are not in the same category. Tableau and Power BI only provide data visualizations plus a little bit of analytics. JarviX not only provides data exploration, so you can find out what the problem is, as well as model management and App builder. If you only look for a dashboard, yes BI is probably enough, but if you constantly feel lacking actionable insights for actual implementations of improvements, JarviX is the choice for you.
I selected Zendesk Explore only to provide an easy and quick access for my managers and supervisors regading metrics and volume trends. Is not the most flexible nor complete data visualization tool, but works well for day-to-day follow ups. You need to use another tool if you want to see long-term patterns (e.g. month over month volume trends) and you need another platform if you want your interaction metrics to interact with other important factors of the business
I think the best part of JarviX is that we can get the analysis results in several minutes. We spent lots of time making reports and managing our data in the past. All in all, it helps us save the time, cost, and labor of managing data.