Chose Klipfolio Klips
Sisense

| Product | Rating | Most Used By | Product Summary | Starting Price |
|---|---|---|---|---|
 Klipfolio Klips | Small Businesses (1-50 employees) | Klipfolio is a customizable dashboard and reporting platform that provides real-time business insights. It is used by small to mid-sized businesses and agencies to track performance metrics and create tailored reports, and to consolidate, transform, and visualize data. | $90 per month | |
 Panorama Necto | N/A | Panorama Necto is a business intelligence solution that provides enterprises with new ways to collaborate and create unique contextual connections. Some key features include: Workboards/Dashboards, Advanced Analytics, and Contextual Discovery. | N/A |
| Klipfolio Klips | Panorama Necto | |||||||||||||||
|---|---|---|---|---|---|---|---|---|---|---|---|---|---|---|---|---|
| Editions & Modules |
| No answers on this topic | ||||||||||||||
| Offerings |
| |||||||||||||||
| Entry-level Setup Fee | Optional | No setup fee | ||||||||||||||
| Additional Details | Discount available for annual pricing. There are various implementation and training options available, from a 60 Day Proof of Concept, to Onboarding & Training, or ongoing dedicated Data Hero support. | — | ||||||||||||||
| More Pricing Information | ||||||||||||||||
| Klipfolio Klips | Panorama Necto | |
|---|---|---|
| Considered Both Products |  Klipfolio Klips  Gulam Gaus Warsi Marketing Specialist Chose Klipfolio Klips Klipfolio is a more flexible tool when we consider its many functions. These functions allows the us to create a dashboard which can combine multiple data sources. These combinations of data sources often provide deeper insights when compared with other visualization tools. …  Nigel Runesu Digital Marketing Consultant Chose Klipfolio Klips Google Data Studio, Microsoft Power BI and Tableau Public  Art Stiefel VP, Digital Strategy Chose Klipfolio Klips Over the years, I have been required to work with other platforms to collect and analyze data for a variety of ad agencies and clients that I have worked with. It really came down to a Goldilocks comparison where we consistently found that dashboard platforms were bloated with …  Parker O'Very Manager of Marketing Operations Chose Klipfolio Klips These and many other BI tools are the most direct competitors. I only have experience with Klipfolio and Tableau. Tableau is definitely more capable, but much more difficult to learn and use. Klipfolio is simple and really packs a punch for its simplicity. I have yet to run …  Dave Moll Digital Marketing Manager Chose Klipfolio Klips Klipfolio had the best API. We could connect more MarTech with Klipfolio than any other BI tool we used. Klipfolio's API was also the most stable. We ran into connectivity issues with some of the competitors. The metrics wouldn't refresh because the API lost the connection …  Francois Salvert Web Analytics and Data dashboarding (consulting mandate) Chose Klipfolio Klips Klipfolio is certainly the best solution for dashboards. Compared to Power BI, Power BI is more of an analyst tool to build deep analysis and reports. Making and sharing dashboards in Power BI is a pain. Tableau is great but cost way more. Also, the skills needed to build …  Rubem Klein Jr. Product Performance Analyst Chose Klipfolio Klips We used Redash before. It isn't as friendly, easy to use and with a great customer support as Klipfolio. Klipfolio simply has way more features available that won't require you to hard-code.  Brian Dainis CEO Chose Klipfolio Klips Birst, Tableau, Grow, MS BI, Google Docs/Sheets, Sisense  Stephanie Dias Analista de conteúdo Chose Klipfolio Klips I never used other products  Arjanne Pruntel Head of Commerce Chose Klipfolio Klips Less sources to connect.  Colin Castle Director of Sales and Marketing Chose Klipfolio Klips They are all based on a similar methodology (Excel) but I felt Klipfolio had better integrations and their support team has been the difference maker. For a company that needs some hand-holding and guidance, Klipfolio is the right choice.  Henrik Christensen Ranger & Virtual CEO Chose Klipfolio Klips QuoteWerks  Roger Crist, Jr. Director of Finance Chose Klipfolio Klips Klipfolio is cloud-based, allows for customization, reliable, and intuitive. The competitors were all lacking in one or more areas.  Chris Williams Director of Marketing Chose Klipfolio Klips I have not personally tried any other products like Klipfolio, but based on my personal experience Klipfolio has a strong foundation for their platform and I feel its only going to get better over time as they grow. I would encourage people to give a few platforms a try and I … |  Panorama Necto  Hema Malini Senior Software Engineer Chose Panorama Necto Tableau Desktop and Pentaho  Felix BOGNOU Datawarehouse and BI Architect Chose Panorama Necto Panorama Necto is a very self service BI, data discovery and automation tool. It empowers business users with data discovery tools.  Malabyajit Roy IT Analyst Chose Panorama Necto More visually enriched infographics and geo analytics and lower license cost means Panorama is a front runner in comparison to the tools mentioned above.  Sarmista Nath Senior Sofware Engineer Chose Panorama Necto No I have not used any other self service BI tool.  Nidhish Khare BI Developer Chose Panorama Necto This is the next generation BI tool, which will be very helpful for small and medium businesses to kick start data exploration and visualization of their diverse databases, with less intervention from IT. This tool is more end user centric and gives way more power to the end …  Sidharth Dash Data Visualization and BI Consultant Chose Panorama Necto One of the best tools in the market available today. I started getting attached to this tool recently and this never stops amazing me. I can connect to a variety of data sources and quickly analyze my data. The best part of this product is the built-in intelligence system which … Chose Panorama Necto We compared Panorama Necto with another leading product. Necto's cost and visual appeal were certainly winners.  Dileep Kumar Varala System Analyst Chose Panorama Necto We can visualize the data right away in Necto. Where as we have to create reports in SAP Business Objects to present it to the business user. The reports have to be scheduled at particular time to get the presentation. We need to have additional SDK code for SAP Business …  Dilip Prajapati BI Developer Chose Panorama Necto We have evaluated few small vendor's BI tools for reporting purposes. Among other BI tools, we found Necto is quite easy to use and provides very good data visualization. Also it provides collaboration features which are least supported by other BI tools.  Chittiappa Areyada QA Lead & Test Analyst Disney Consumer Products for Satwic Inc Chose Panorama Necto In comparison with Pentaho Business Analytics, Panorama Necto 14 is providing similar features where it is distinguished through its provision of a suggestive analytics feature. This is fairly unique to the Panorama Necto 14 software where it analyzes information from various …  Snehal Katariya CSM, CSPO Product Owner / Business Analyst Chose Panorama Necto  Rajan Patel BI Intelligence Developer Chose Panorama Necto It works very well with Microsoft tools and platforms.  Aditya Singh Programmer Analyst Chose Panorama Necto We are evaluating different data visualization tools and recently I tried Panorama Necto. I was really amazed with this product as it's a new age technology and powerful tool for visualizing data, creating reports. It comes with Infographics which is great and best unique …  manshul goel IT Analyst Chose Panorama Necto we are assessing latest BI tools available in market for customer  Soumya Roy Senior BI Analyst Chose Panorama Necto All the above mentioned BI tools are complex from a maintenance perspective. They are not easy to learn. All those BI tools have limited cloud based reporting capability. Whereas Necto is a fully web based self service BI tool. It's collaborative capability makes it stack up …  Lewis Ewing UI Designer Chose Panorama Necto It provides attractive info-graphics according to user's interest. Their visual materiels are modern and stylish. You can use the same dashboard everywhere. Necto always keeps you up-to-date through mobile devices. It gives you many automated analysis and recommendations …  Gaurav Pandya Data Analyst Chose Panorama Necto Collaboration on data is super powerful in the case of Necto and wins all the medals compared to other BI tools. The real time analysis for decision making is extremely easy and just a click away, which is really not a smooth case for other BI tools.  GP Nath Data Analyst Chose Panorama Necto
 Milos Milenkovic Senior Business Intelligence/Reporting Developer Chose Panorama Necto Tableau, QlikView, Power BI, Klipfolio, Zoho Reports... |
| Klipfolio Klips | Panorama Necto | |||||||||||||||
|---|---|---|---|---|---|---|---|---|---|---|---|---|---|---|---|---|
| BI Standard Reporting |
| |||||||||||||||
| Ad-hoc Reporting |
| |||||||||||||||
| Report Output and Scheduling |
| |||||||||||||||
| Data Discovery and Visualization |
| |||||||||||||||
| Access Control and Security |
| |||||||||||||||
| Mobile Capabilities |
|
| Klipfolio Klips | Panorama Necto | |
|---|---|---|
| Small Businesses |  Supermetrics Score 9.7 out of 10 |  Yellowfin Score 8.6 out of 10 |
| Medium-sized Companies | Supermetrics Score 9.7 out of 10 |  Reveal Score 10.0 out of 10 |
| Enterprises |  IBM Analytics Engine Score 7.1 out of 10 |  Kyvos Semantic Layer Score 9.5 out of 10 |
| All Alternatives | View all alternatives | View all alternatives |
| Klipfolio Klips | Panorama Necto | |
|---|---|---|
| Likelihood to Recommend | 8.8 (0 ratings) | 8.0 (0 ratings) |
| Likelihood to Renew | - (0 ratings) | 8.0 (0 ratings) |
| Usability | 9.5 (0 ratings) | 8.2 (0 ratings) |
| Support Rating | 9.1 (0 ratings) | 7.1 (0 ratings) |
| Implementation Rating | 8.2 (0 ratings) | 6.7 (0 ratings) |
| Klipfolio Klips | Panorama Necto | |
|---|---|---|
| Likelihood to Recommend |
|
Soumya Roy Senior BI Analyst |
| Pros |
Parker O'Very Manager of Marketing Operations |
Sarmista Nath Senior Sofware Engineer |
| Cons |
 Lisa Wester Email Marketing Strategist, Chief Engagement Officer & Founder |
Felix BOGNOU Datawarehouse and BI Architect |
| Likelihood to Renew | No answers on this topic |
Lewis Ewing UI Designer |
| Usability |
|
Milos Milenkovic Senior Business Intelligence/Reporting Developer |
| Support Rating |
|
Hema Malini Senior Software Engineer |
| Implementation Rating |
 Miguel Ángel del Hoyo Marketing & Analytics Consultant |
Milos Milenkovic Senior Business Intelligence/Reporting Developer |
| Alternatives Considered |
|
Chittiappa Areyada QA Lead & Test Analyst Disney Consumer Products for Satwic Inc |
| Return on Investment |
Art Stiefel VP, Digital Strategy | No answers on this topic |
| ScreenShots | Klipfolio Klips Screenshots      | Panorama Necto Screenshots 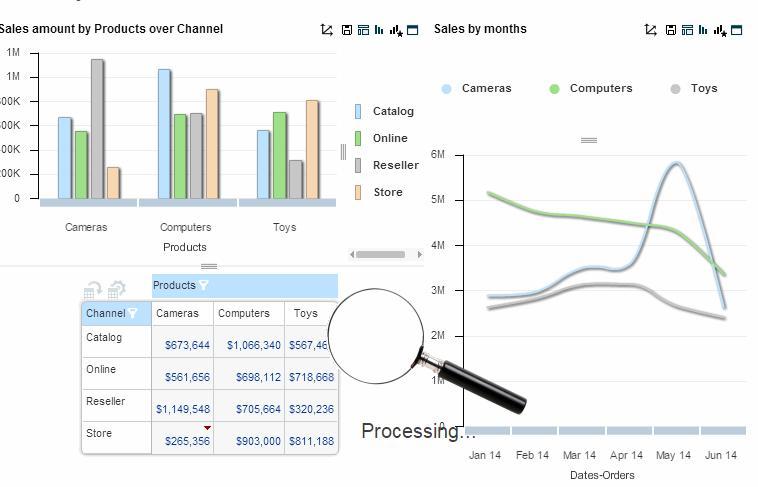 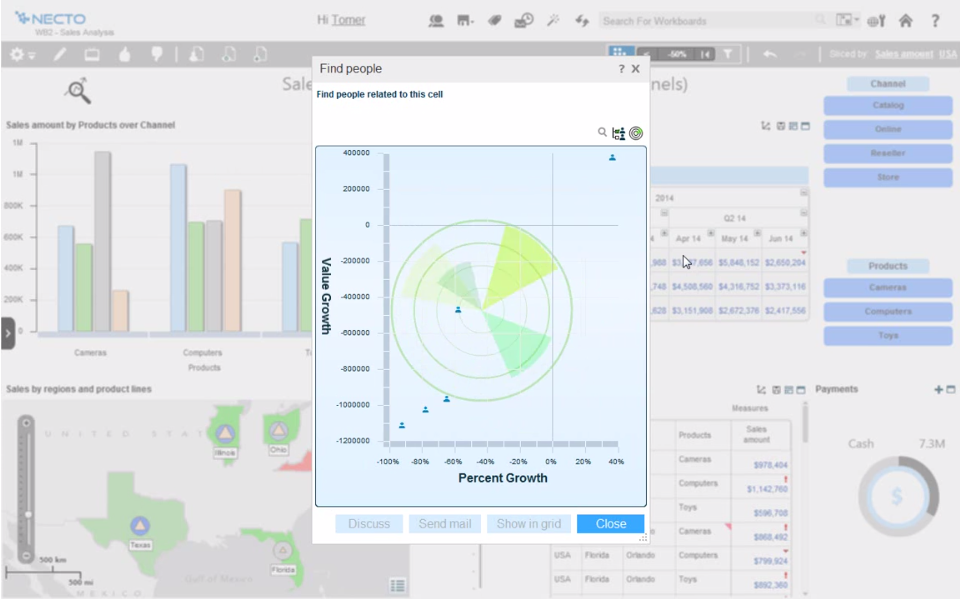   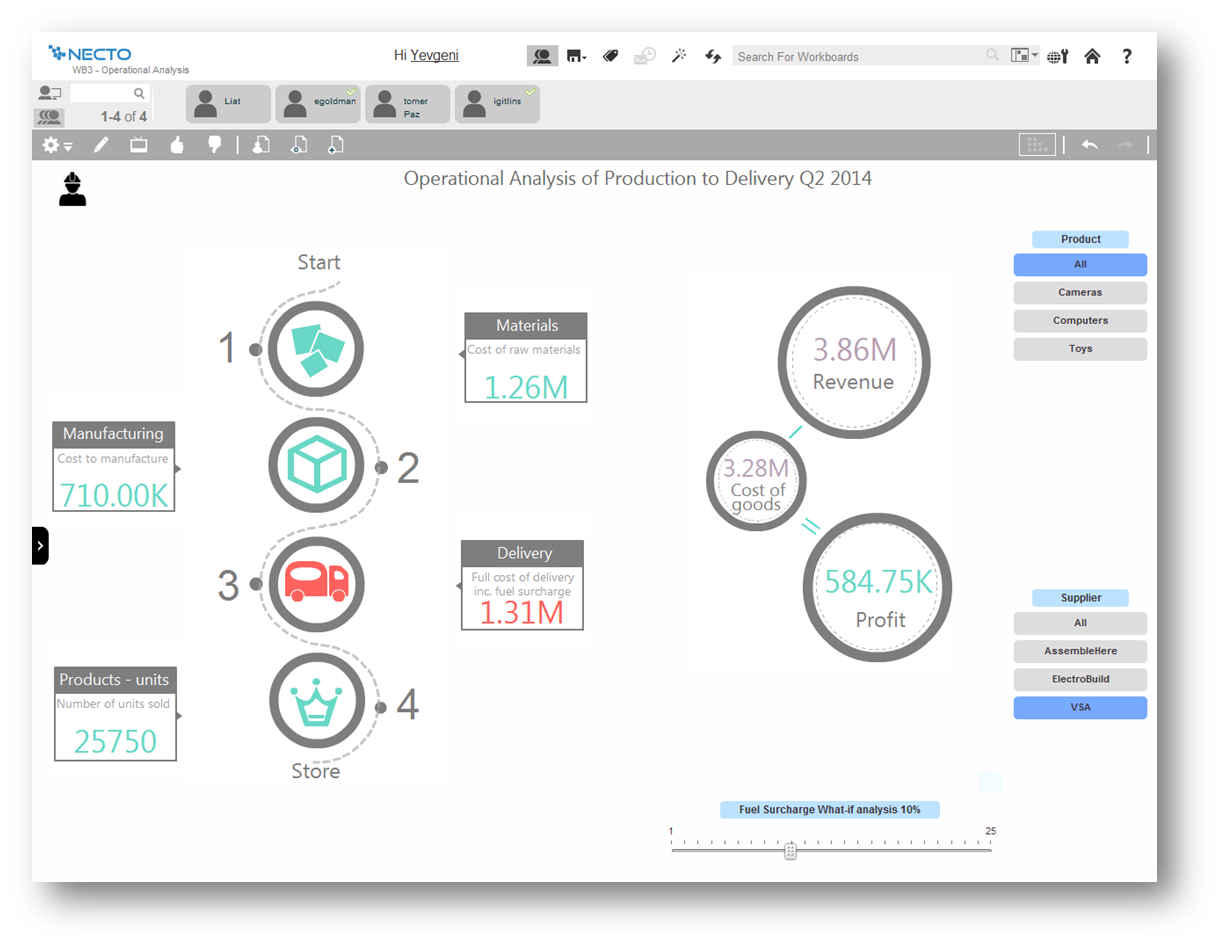 |
