Oracle Coherence is database management and development software.
N/A
SolarWinds Database Performance Monitor
Score9 out of 10
N/A
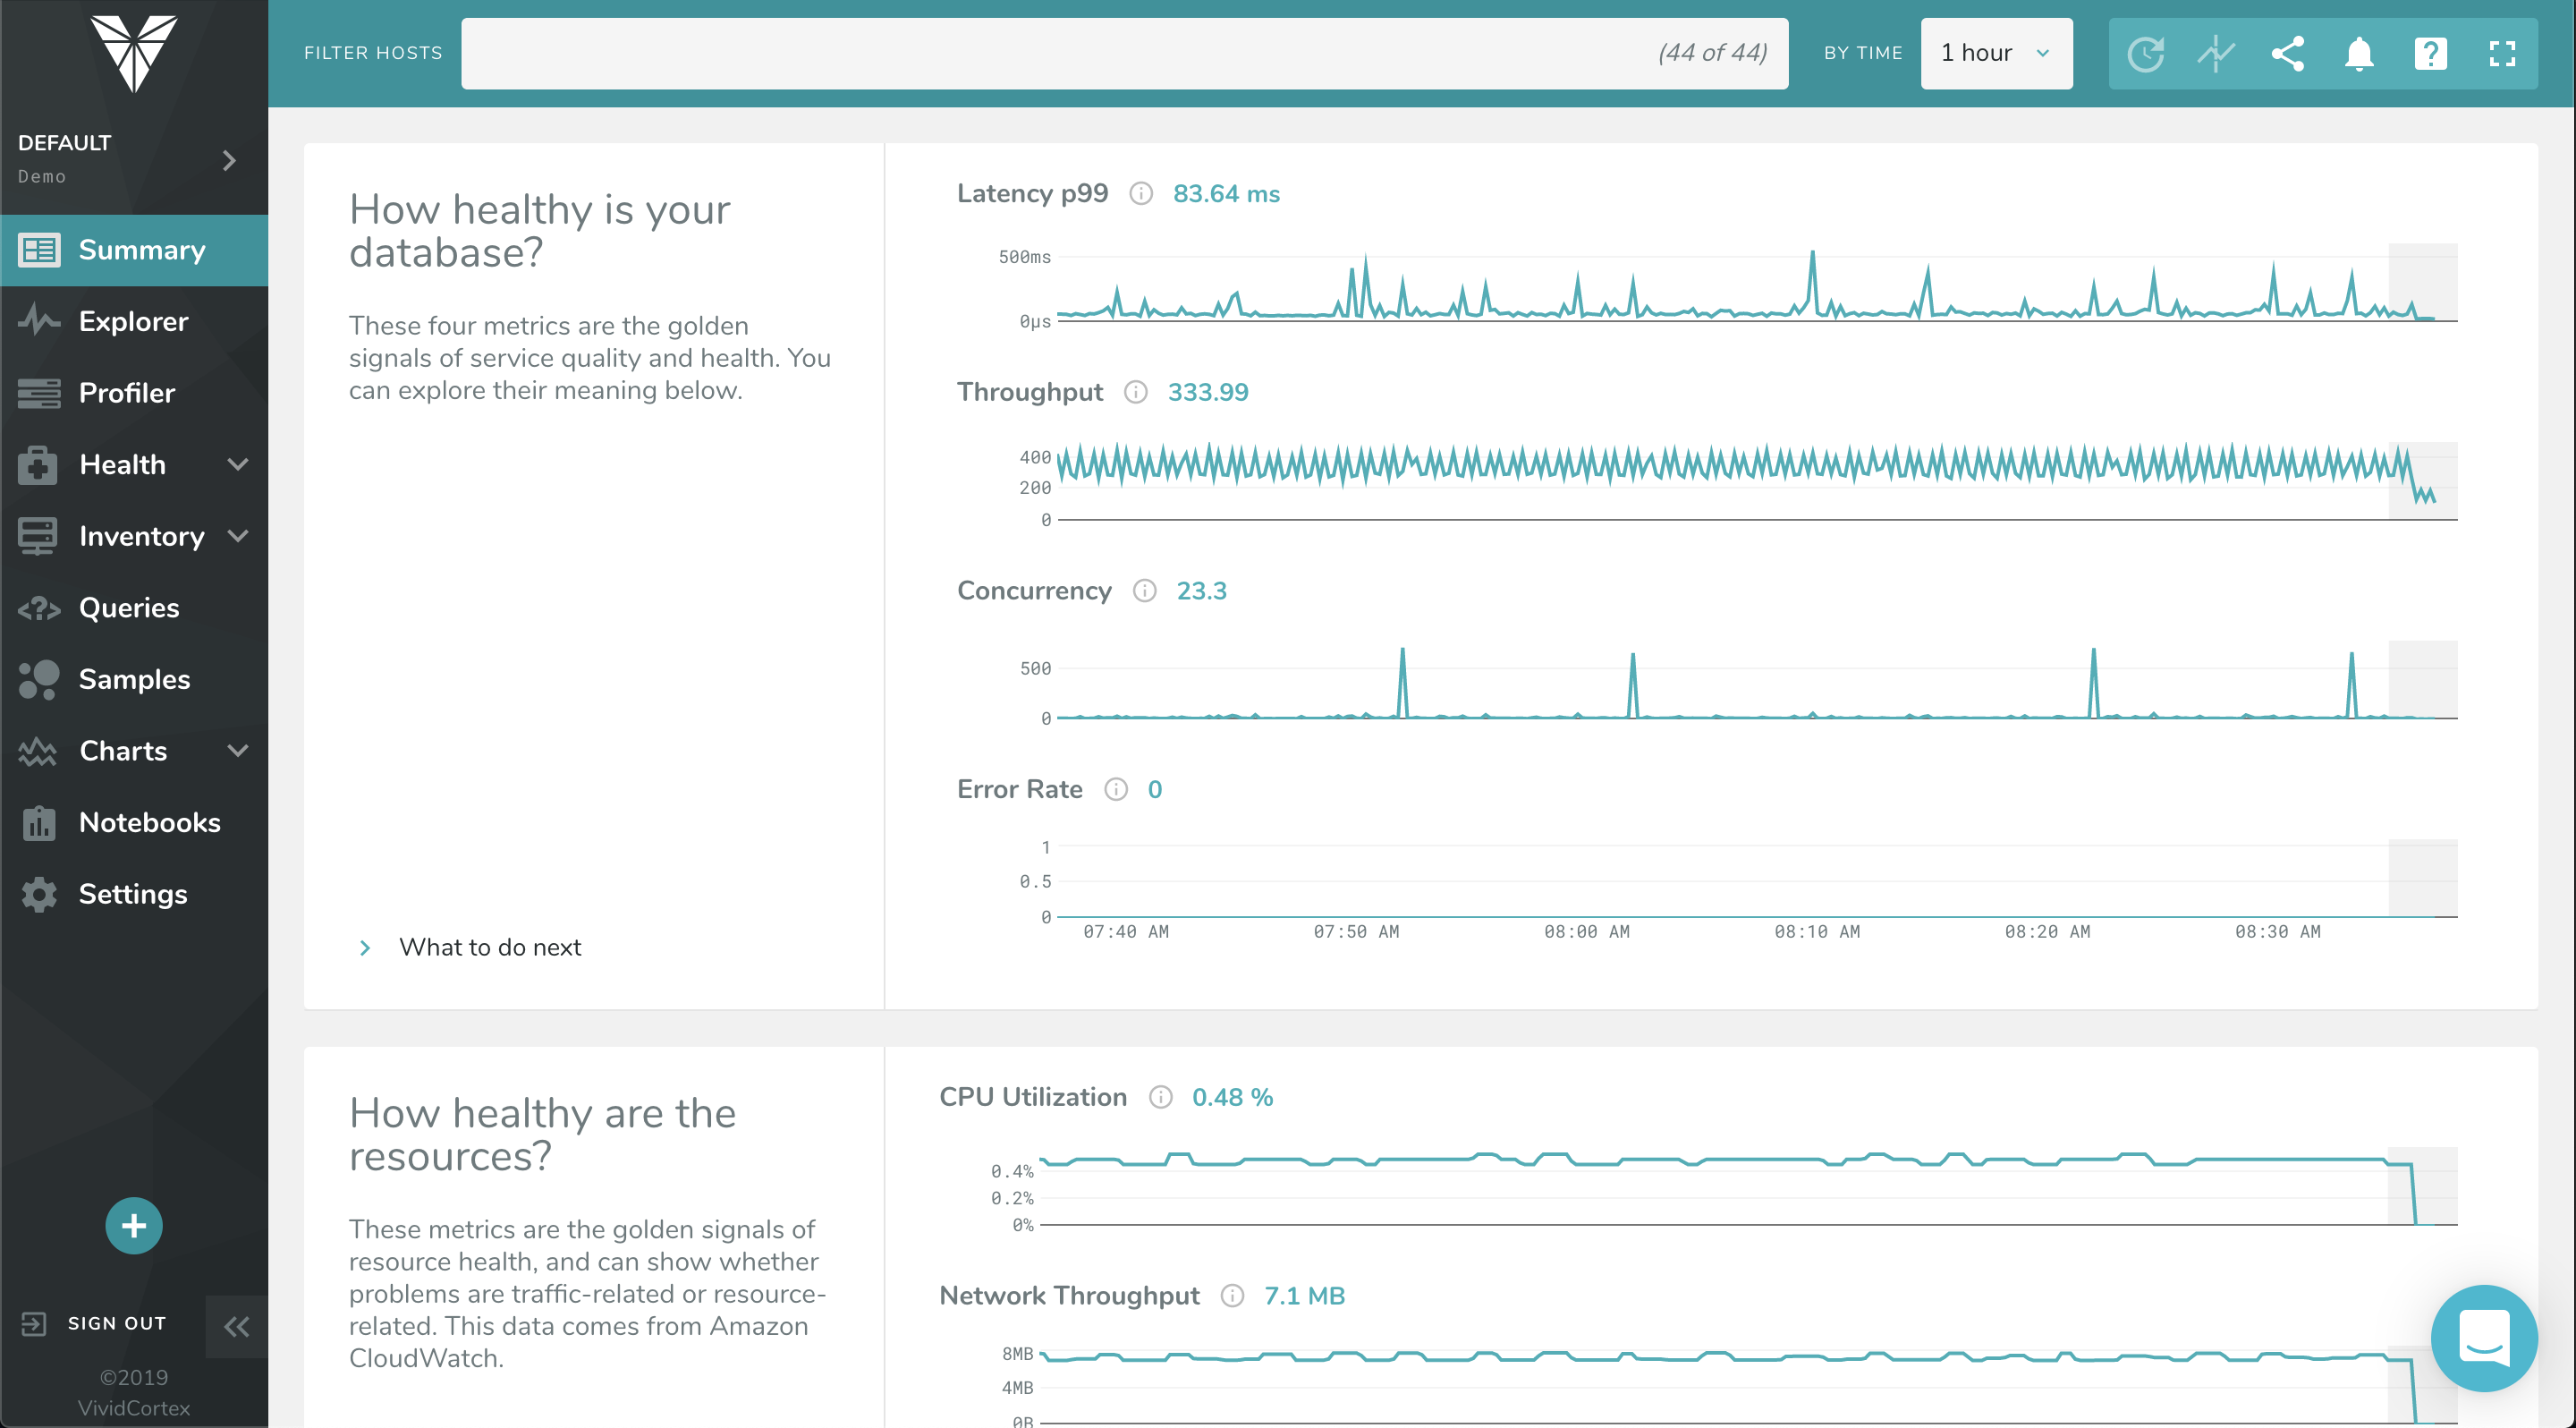
VividCortex, acquired by SolarWinds in
December 2019, provides database performance monitoring designed to increase
system performance, team efficiency, and infrastructure cost savings. The GDPR-
and SOC 2-compliant platform offers visibility into major open-source databases—MySQL,
PostgreSQL, Amazon Aurora, MongoDB, and Redis—for the engineering team at
scale. Industry leaders like Etsy, GitHub, SendGrid, and Yelp rely on Database
Performance Monitor for all-query monitoring and drill…
N/A
Pricing
Oracle Coherence
SolarWinds Database Performance Monitor
Editions & Modules
No answers on this topic
No answers on this topic
Offerings
Pricing Offerings
Oracle Coherence
SolarWinds Database Performance Monitor
Free Trial
No
Yes
Free/Freemium Version
No
No
Premium Consulting/Integration Services
No
Yes
Entry-level Setup Fee
No setup fee
No setup fee
Additional Details
—
—
More Pricing Information
Features
Oracle Coherence
SolarWinds Database Performance Monitor
Database Development
Comparison of Database Development features of Oracle Coherence and SolarWinds Database Performance Monitor
Feature
Oracle Coherence
8.7
4 Ratings
2% above category average
SolarWinds Database Performance Monitor
-
Ratings
Version control tools
9.02 Ratings
00 Ratings
Test data generation
8.21 Ratings
00 Ratings
Performance optimization tools
9.34 Ratings
00 Ratings
Schema maintenance
9.02 Ratings
00 Ratings
Database change management
8.02 Ratings
00 Ratings
Database Administration
Comparison of Database Administration features of Oracle Coherence and SolarWinds Database Performance Monitor
Oracle Coherence can be used to solve latency problems by caching data near the application tier. In-memory performance helps to reduce data contention, thus improving application response time. Oracle Coherence does a great job at scaling linearly and can do so dynamically. Oracle Coherence can replicate data so it can be part of a disaster recovery solution. One thing that is often overlooked with elastic caches is their ability to analyze data in memory, leveraging the processing power of the data grid. This is something Oracle Coherence does exceptionally well. Oracle Coherence also provided event handling capabilities to allow applications to respond to events triggered by transactions.
A de minimis incentive was given to thank the reviewer for their time. The incentive was not used to bias or drive a particular response, nor was the incentive contingent on a positive endorsement. More Info
Computing resources consumed by the DB instance, DPA queries & wait time, deadlock conditions, virtual infrastructure resources. The addition of NPM & DPA integration as well as cross-correlation in the identification of issues with the network or server or DB is all stupid-proof. Monitoring is more than just health and resource consumption, it's also performance. DB performance analysis is key to maintaining healthy DB instances.
A de minimis incentive was given to thank the reviewer for their time. The incentive was not used to bias or drive a particular response, nor was the incentive contingent on a positive endorsement. More Info
A de minimis incentive was given to thank the reviewer for their time. The incentive was not used to bias or drive a particular response, nor was the incentive contingent on a positive endorsement. TR verified that a representative sample of customers was invited. More Info
A de minimis incentive was given to thank the reviewer for their time. The incentive was not used to bias or drive a particular response, nor was the incentive contingent on a positive endorsement. More Info
A de minimis incentive was given to thank the reviewer for their time. The incentive was not used to bias or drive a particular response, nor was the incentive contingent on a positive endorsement. More Info
A de minimis incentive was given to thank the reviewer for their time. The incentive was not used to bias or drive a particular response, nor was the incentive contingent on a positive endorsement. More Info
I would say it is a very good tool from overall perspective compared to what I have used till now, still I will give it like 9 just for the sake of the interface and the integration which they should be doing soon with the main module which is SAM , NPM etc.
A de minimis incentive was given to thank the reviewer for their time. The incentive was not used to bias or drive a particular response, nor was the incentive contingent on a positive endorsement. More Info
Oracle Coherence support team is responsive and knowledgeable. We contacted them to ask a couple of design questions about how we were setting up Oracle Coherence based on how we used IBM's Datapower Extreme Scale. They were able to guide us so that we got the design correct the first time and didn't have to go back and re-architect our design later.
A de minimis incentive was given to thank the reviewer for their time. The incentive was not used to bias or drive a particular response, nor was the incentive contingent on a positive endorsement. More Info
DataSynapse GridServer has the same cache functionality connected with a grid distributed application deployment platform. It provides all the necessary tools to configure and manage these applications. On the otherhand Oracle Coherence has more a flexible configuration and better performance. Also the Oracle configuration and monitoring tools are more convenient and informative than the DataSynapse ones.
A de minimis incentive was given to thank the reviewer for their time. The incentive was not used to bias or drive a particular response, nor was the incentive contingent on a positive endorsement. More Info
SolarWinds DPA gives you a very deep analysis and monitoring of the devices which these tools will not give you neither Datadog or ManageEngine. It even gives you job rate , db locks and all other parameters to monitor which we usually do manually by going in to the DB and not from the tools. It also creates a dashboard out of the same.
A de minimis incentive was given to thank the reviewer for their time. The incentive was not used to bias or drive a particular response, nor was the incentive contingent on a positive endorsement. More Info
In my current project, it is yet to be decided as we are on the way to make it live for users. But I am sure it will be an added value to obtain timely calculations.
A de minimis incentive was given to thank the reviewer for their time. The incentive was not used to bias or drive a particular response, nor was the incentive contingent on a positive endorsement. More Info
A de minimis incentive was given to thank the reviewer for their time. The incentive was not used to bias or drive a particular response, nor was the incentive contingent on a positive endorsement. More Info