TrustRadius
SolarWinds Database Performance Monitor

SolarWinds Database Performance Monitor
Formerly VividCortex

Overview

What is SolarWinds Database Performance Monitor?

VividCortex, acquired by SolarWinds in December 2019, provides database performance monitoring designed to increase system performance, team efficiency, and infrastructure cost savings. The GDPR- and SOC 2-compliant platform offers visibility into major open-source databases—MySQL, PostgreSQL, Amazon Aurora, MongoDB, and Redis—for the engineering team at scale.…

Read more
Recent Reviews

TrustRadius Insights

Users of the software have found it to be incredibly helpful in monitoring and managing their databases. With its ability to monitor …
Continue reading
Read all reviews

Awards

Products that are considered exceptional by their customers based on a variety of criteria win TrustRadius awards. Learn more about the types of TrustRadius awards to make the best purchase decision. More about TrustRadius Awards

Return to navigation

Pricing

View all pricing
N/A
Unavailable

What is SolarWinds Database Performance Monitor?

VividCortex, acquired by SolarWinds in December 2019, provides database performance monitoring designed to increase system performance, team efficiency, and infrastructure cost savings. The GDPR- and SOC 2-compliant platform offers visibility into major open-source…

Entry-level set up fee?

  • No setup fee
For the latest information on pricing, visithttp://www.solarwinds.com

Offerings

  • Free Trial
  • Free/Freemium Version
  • Premium Consulting/Integration Services

Would you like us to let the vendor know that you want pricing?

2 people also want pricing

Alternatives Pricing

What is DBeaver?

DBeaver offers comprehensive data management tools designed to help teams explore, process, and administrate SQL, NoSQL, and cloud data sources. DBeaver is available commercially as DBeaver PRO and for free as DBeaver Community.

What is pganalyze?

Founded in 2012, pganalyze provides actionable insights into Postgres. Specializing in PostgreSQL database monitoring and optimization, pganalyze gives automatic insights into Postgres query plans, helps improve Postgres query performance with its Index Advisor and VACUUM Advisor, and lets the user…

Return to navigation

Product Details

What is SolarWinds Database Performance Monitor?

VividCortex, acquired by SolarWinds in December 2019, provides database performance monitoring designed to increase system performance, team efficiency, and infrastructure cost savings. The GDPR- and SOC 2-compliant platform offers visibility into major open-source databases—MySQL, PostgreSQL, Amazon Aurora, MongoDB, and Redis—for the engineering team at scale. Industry leaders like Etsy, GitHub, SendGrid, and Yelp rely on Database Performance Monitor for all-query monitoring and drill-down views across thousands of servers concurrently.

How customers use Database Performance Monitor:

Before an issue arises:

  • Reduce risk – after a code deployment, find changes and explore query response
  • Improve performance – identify outliers and see system changes over time
  • Gain efficiency – get recommendations, find configuration issues, and customize alerts

During and after:

  • Speed recovery – quickly isolate potential issues in the database
  • Understand – see detailed query behavior across servers for deep visibility
  • Get support – database experts can help answer your questions fast

Database Performance Monitor is designed to make it easy for every engineer to deploy code with confidence, troubleshoot and diagnose outages, and monitor database health. Support includes documentation, a customer success team, email, phone, video, and in-app chat.


SolarWinds Database Performance Monitor Features

  • Supported: Adaptive Fault Detection
  • Supported: 1-Second Granularity
  • Supported: Baseline and A/B Comparisons
  • Supported: Detailed Data Visualizations
  • Supported: Domain-specific intelligence on queries, configuration, and security
  • Supported: SaaS monitoring with a web-based user interface
  • Supported: Monitors databases in any cloud, locally, or hybrid
  • Supported: Lightweight agents via multiple configurations
  • Supported: GDPR & SOC2 compliant

SolarWinds Database Performance Monitor Screenshots

Screenshot of The Profiler Dashboard is a powerful, dynamic dashboard for ranking and filtering activity on your servers: It can instantly show you what needs attention and it provides a unified view of all your database types that VividCortex monitors. It enables you to view and understand your system by profiling it according to its most significant attributes—customized and selected by you.Screenshot of This dashboard displays a list of queries and allows you to filter them with powerful specificity. Filters can be set according to query text, host, and timeframe when the query was first seen / last active.Screenshot of VividCortex captures an enormous amount of data, and the Summary Dashboard helps users make sense of it, reducing their time-to-insight. It features widgets with automatic displays for Top 5 Queries by Total Time, Top 5 Queries by User CPU, Application Overview, Critical Events, and more.Screenshot of VividCortex monitors thousands of metrics in your system, and the Charts and Dashboard’s navigation pane allows you to toggle, customize, and enable various categories of generated charts. You can then easily navigate and examine the charts’ metrics with mouseover and zoom capabilities.

SolarWinds Database Performance Monitor Integrations

SolarWinds Database Performance Monitor Competitors

SolarWinds Database Performance Monitor Technical Details

Deployment TypesSoftware as a Service (SaaS), Cloud, or Web-Based
Operating SystemsUnspecified
Mobile ApplicationNo
Supported LanguagesEnglish
Return to navigation

Comparisons

View all alternatives
Return to navigation

Reviews and Ratings

(13)

Community Insights

TrustRadius Insights are summaries of user sentiment data from TrustRadius reviews and, when necessary, 3rd-party data sources. Have feedback on this content? Let us know!

Users of the software have found it to be incredibly helpful in monitoring and managing their databases. With its ability to monitor fragmentation, I/O, and individual components, users are able to keep a close eye on their databases' performance. The server availability and threshold alerts have been particularly useful, allowing reviewers to quickly identify and resolve any issues even when servers are up and running. Customers have praised the software for its ability to monitor database performance and analyze logs, providing them with valuable insights. The historical logs collection feature has been especially beneficial in improving overall performance. Additionally, the software's deep visibility into database performance makes it an excellent tool for performance optimization and tuning. Users have also found it effective at quickly debugging database-related issues by monitoring a wide range of metrics and analyzing anomalies. Overall, customers appreciate the software's ability to track key SQL queries, optimize server performance, and provide valuable information for addressing potential problems.

Customizable Options: Users have expressed their appreciation for the wide range of options available to customize and play with in SolarWinds software. This level of customization allows users to tailor the software to their specific needs and preferences, enhancing their overall experience.

Helpful Performance Analyzer: Multiple reviewers have found SolarWinds Performance Analyzer to be an invaluable tool for monitoring and analyzing the performance of their databases. With its robust features and capabilities, this tool provides users with valuable insights into database performance, helping them identify issues and optimize performance effectively.

Simplicity and Comprehensive Information: The simplicity of the user interface coupled with the comprehensive information displayed on the dashboard has garnered positive feedback from users. This intuitive design makes it easy for users to navigate through different functionalities while providing them with a holistic view of important metrics and data points related to their databases.

Time-consuming and not user-friendly: Several users have expressed frustration with the software's configuration process, finding it to be time-consuming and difficult to navigate. They have also mentioned that the user interface is not intuitive, requiring additional time and effort to understand and operate effectively.

Unhelpful default alerts: Some reviewers have pointed out that the default setup includes unhelpful alerts, such as the database fragmentation alert, which unnecessarily marks the node as critical. This can lead to confusion and false alarms for users who are not familiar with these alerts or do not find them relevant to their specific needs.

Compatibility issues and lack of discount during renewal: A few customers have experienced compatibility issues with the software when integrating it with other systems or platforms. Additionally, they were disappointed to find that no discount was provided during the renewal process despite encountering these difficulties. This lack of consideration for loyal customers in addressing compatibility challenges has been a source of dissatisfaction for some users.

Reviews

(1-1 of 1)
Companies can't remove reviews or game the system. Here's why
Mike Maner | TrustRadius Reviewer
Score 8 out of 10
Vetted Review
Verified User
Incentivized
As with most companies, DB instances power our business app & DB admins need optimal performance. Having an internal view of DB issues & performance helps us optimize the DB instances that are integral to operations.
  • Simple to use and very easy to learn.
  • The execution engines run in parallel, can execute any syntax or query.
  • DPN can run all queries for both Oracle and SQL with no additional support.
  • The Reporting feature currently doesn't allow customization.
Computing resources consumed by the DB instance, DPA queries & wait time, deadlock conditions, virtual infrastructure resources. The addition of NPM & DPA integration as well as cross-correlation in the identification of issues with the network or server or DB is all stupid-proof. Monitoring is more than just health and resource consumption, it's also performance. DB performance analysis is key to maintaining healthy DB instances.
  • Virtual infrastructure resource monitoring.
  • DB performance analysis.
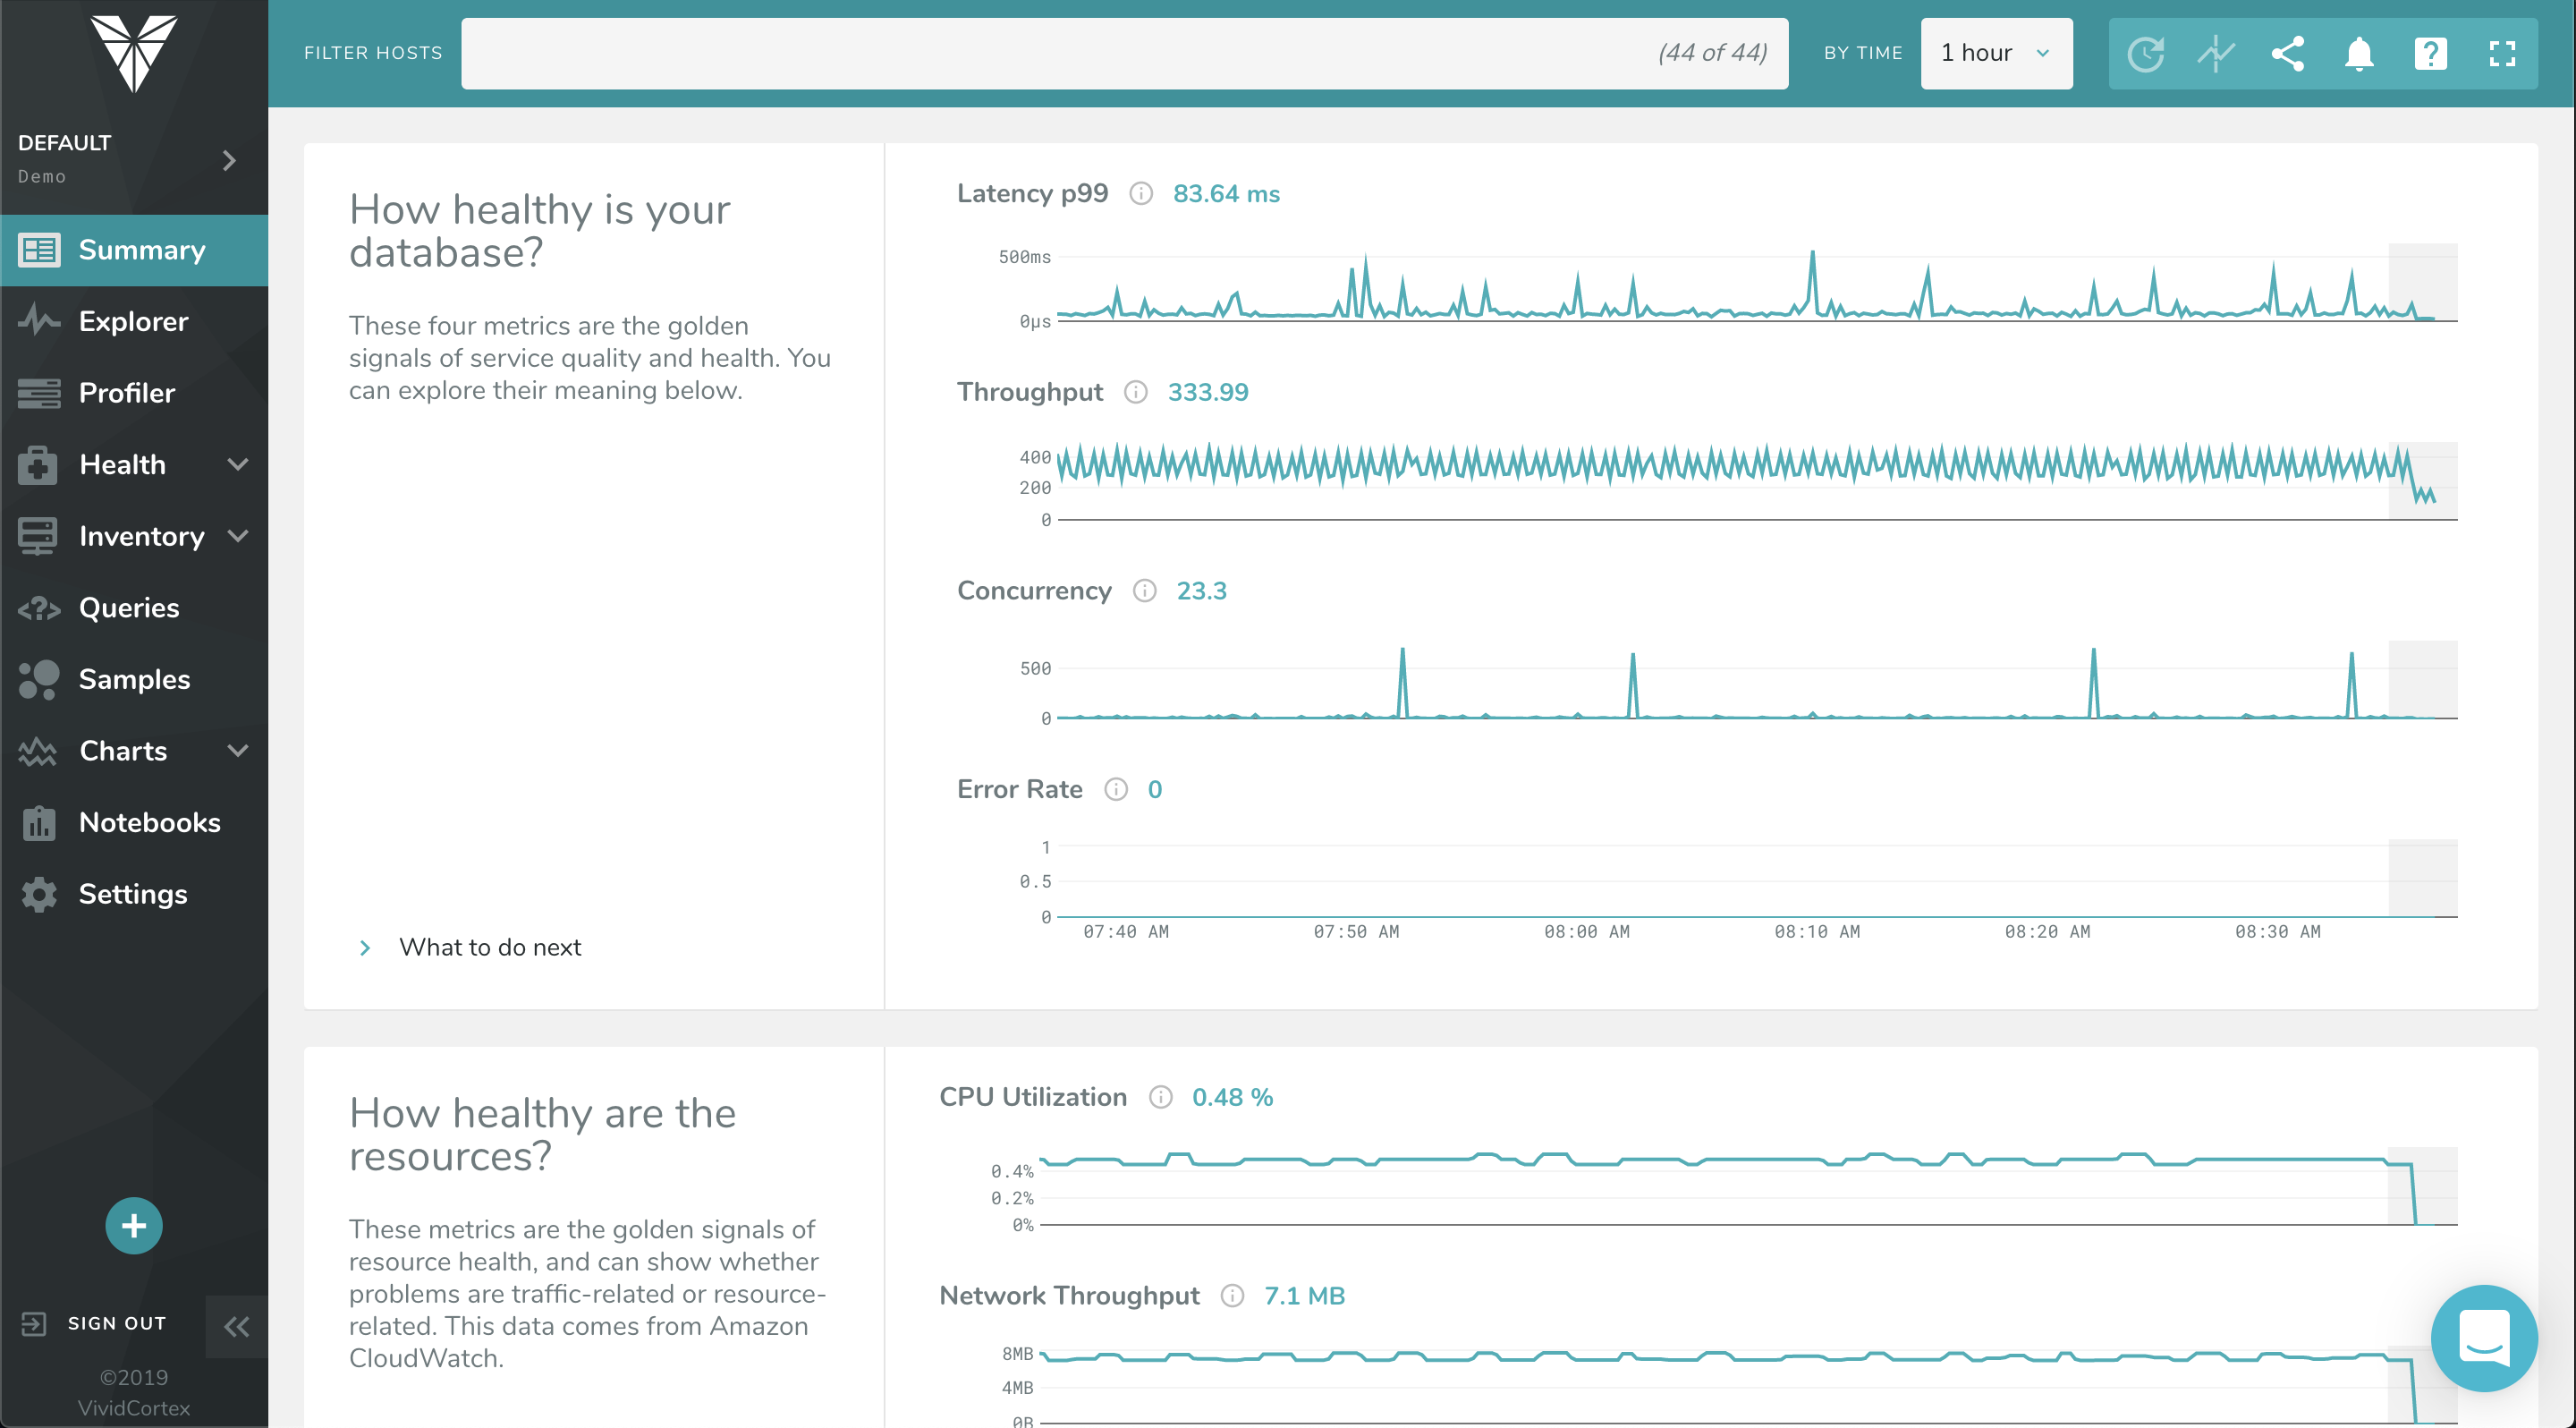
  • Internal view of DB issues & performance.
  • What is the cost of a downed DB instance? That's your ROI. DPM lets you see issues before they become critical.
DPM is less expensive and more feature-rich. Also, Oracle tech support is garbage, unless you can afford to spend a day getting assistance.
IFS Applications, Carbonite Backup for Microsoft 365, Carbonite Endpoint, SonicWall Capture Advanced Threat Protection (ATP)
Return to navigation