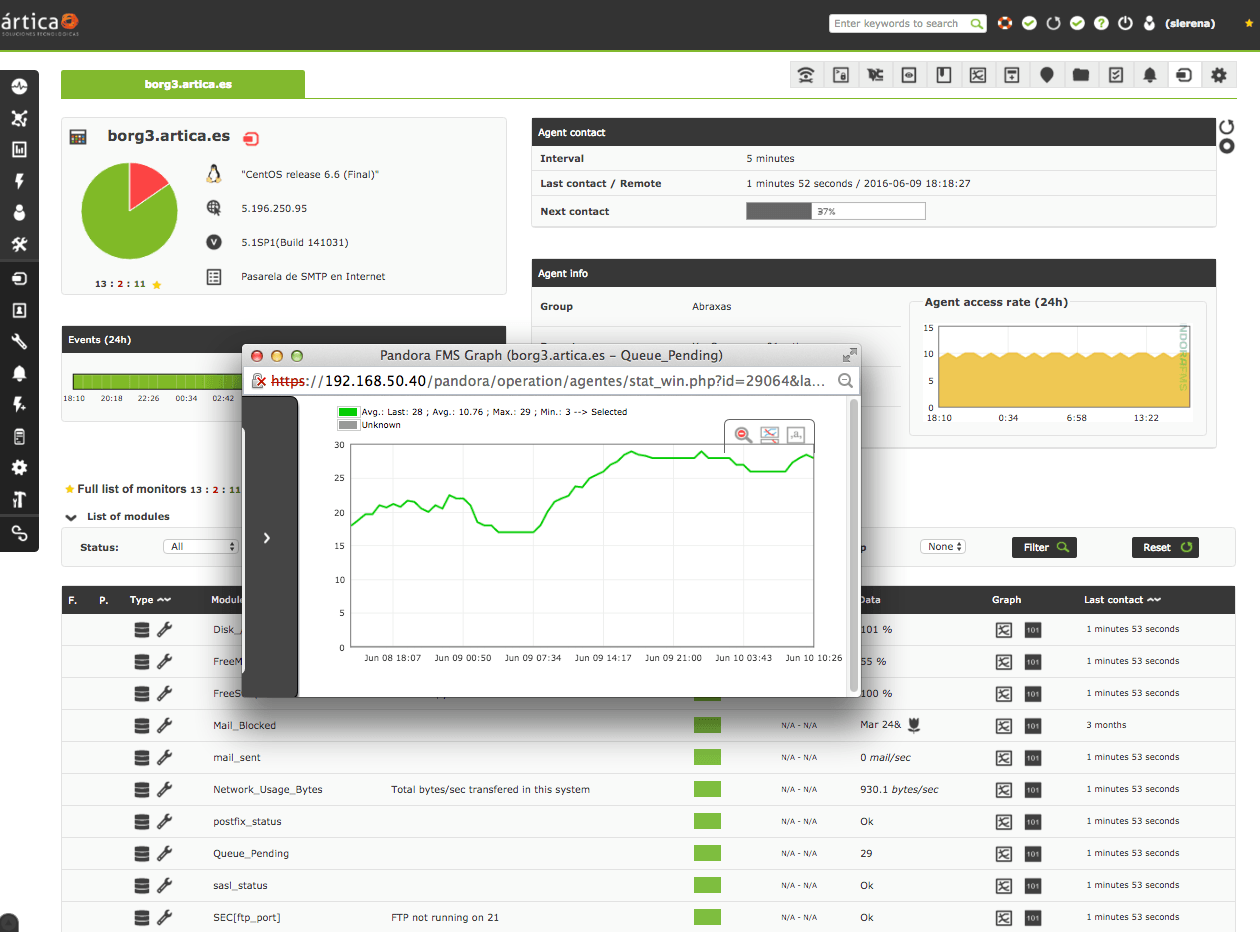
Pandora FMS is a monitoring solution. It is presented as ideal for medium and big-sized environments with at least 100 devices. Users can monitor any device, infrastructure, application, IT as well as business processes and services. It allows business users to obtain information from their concerns in real time, visualizing the data in a direct way. The solution boasts users among companies and organizations in more than 40 countries around the world, who according…
$2,990
100 nodes
Prometheus
Score 7.9 out of 10
N/A
Prometheus is a service monitoring and time series database, which is open source.
N/A
Pricing
Pandora FMS
Prometheus
Editions & Modules
NMS Edition
$2,990
100 nodes
Enterprise Edition
$4,250
100 nodes
No answers on this topic
Offerings
Pricing Offerings
Pandora FMS
Prometheus
Free Trial
Yes
No
Free/Freemium Version
Yes
No
Premium Consulting/Integration Services
Yes
No
Entry-level Setup Fee
Required
No setup fee
Additional Details
Licensed for individual nodes (agents), starting from 100 nodes.
—
More Pricing Information
Community Pulse
Pandora FMS
Prometheus
Features
Pandora FMS
Prometheus
Network Performance Monitoring
Comparison of Network Performance Monitoring features of Product A and Product B
I believe Pandora FMS is a solution that adapts to any type of scenario; it's useful for small businesses as well as large organizations. It more than meets the need to have a comprehensive monitoring system capable of sending alerts instantly and consulting historical data, logs, and trends. Additionally, for small businesses, the free version will be more than sufficient in most cases. And for those who do not want to deploy the service on-premise, there is an option for MaaS (Monitoring as a Service).
This program works from the roots of the problem and creates a professional matrix for each of its users. This will give them more skills and resources to carry out tasks and reduce the difficulties of operating each of the processes of my work, as well as being An ally for the manipulation and operability of all your master data; Prometheus is very easy to recommend since it is a program that fulfills its mission.
Customer Service: since this is an open-source tool, customer service is not that great. Generally, you get all answers to your problems in online forums, but in case you got stuck, nobody will assist you in a channelised manner. You will have to find the way out on your own, and it may become frustrating at times.
More metrics for dashboards shall be added per the application being monitored. Standards metrics will work in most cases but may not in specific applications. Therefore, customised metrics shall be created for some of the industry-standard niche applications.
The solution is very complete, and even includes extras such as IPAM. Deployment can be a bit unintuitive at first, but once you become familiar with the solution and thanks to its automatic deployment options it ends up being easier than it seemed. The power and options of the solution are its greatest virtue.
It is usable and one can learn if few people in the team are already using it. It can be difficult to understand at the beginning because of non intuitive UI and syntax of the rules. So, I've gone for 7 points as there is some room for improvement in user interface and rules syntax.
Before using Pandora FMS, tests were carried out with all these tools:
Nagios
Zabbix
System Center Operations Manager (SCOM)
IBM Tivoli
PRTG
SolarWinds
Pandora FMS allows simple customization by making adjustments to text files, developing agent add-ons without the need to be a programmer, there is no scenario where we could not take data and save it in PandoraFMS, IoT, industrial products, and everything that any client needs to monitor.
Highly customized pricing plans to choose from. Lower pricing for the same features compared to competitors. Easy to reach the support team, which provided detailed documentation and helped set up the Prometheus. Monitoring metrics gets very easy after the integration with Grafana. It also has a sophisticated alert setting mechanism to ensure we don't miss anything critical.
The ROI mentioned during the purchase has not been achieved, however this could be due to lack of data from our side. 2 years of implementation is too early to calculate and confirm the ROI.