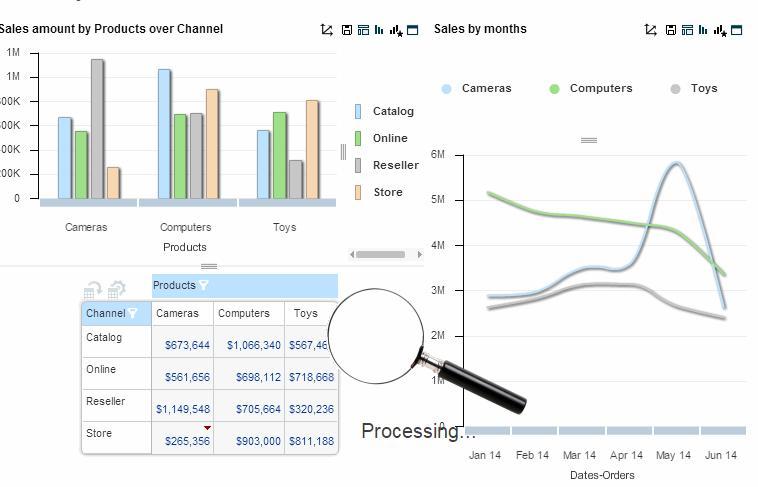
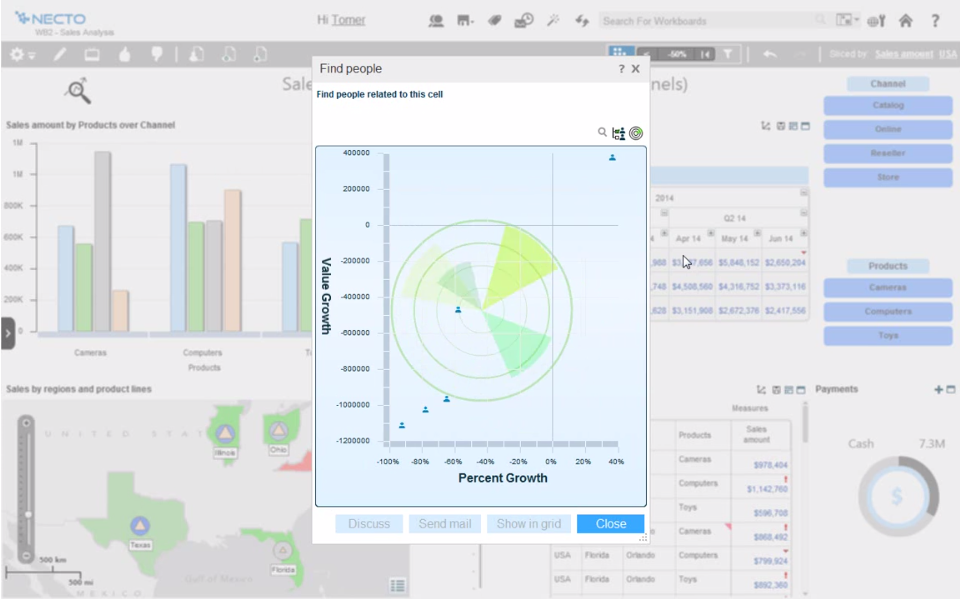
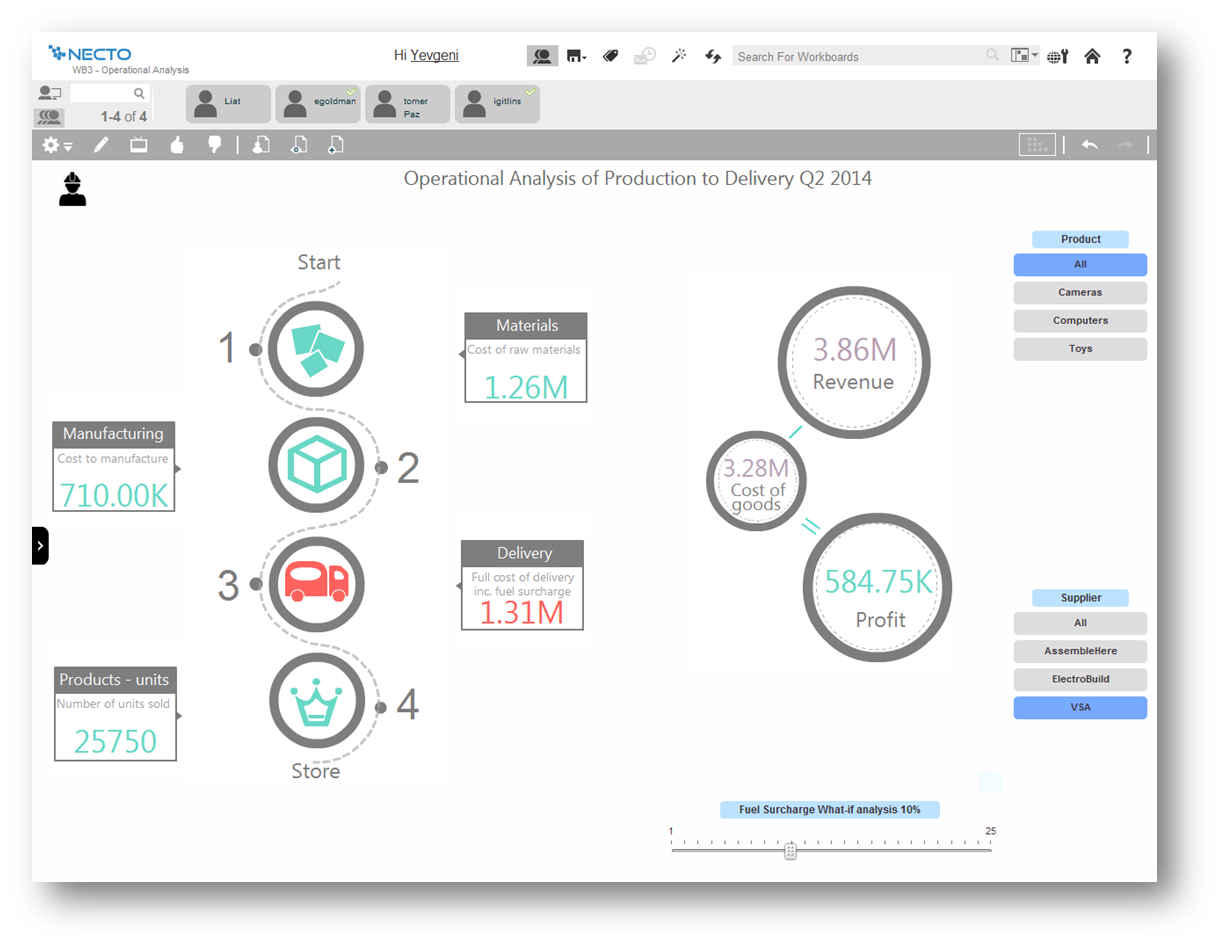
Panorama Necto is a business intelligence solution that provides enterprises with new ways to collaborate and create unique contextual connections. Some key features include: Workboards/Dashboards, Advanced Analytics, and Contextual Discovery.
N/A
Tableau Public
Score9.9 out of 10
N/A
Tableau Public is a free edition of the Desktop product. With this edition, data can only be published to the Tableau public website and does not allow work to be saved or exported locally.
$0
per month
Pricing
Panorama Necto
Tableau Public
Editions & Modules
No answers on this topic
No answers on this topic
Offerings
Pricing Offerings
Panorama Necto
Tableau Public
Free Trial
Yes
No
Free/Freemium Version
No
Yes
Premium Consulting/Integration Services
Yes
No
Entry-level Setup Fee
No setup fee
No setup fee
Additional Details
—
—
More Pricing Information
Features
Panorama Necto
Tableau Public
BI Standard Reporting
Comparison of BI Standard Reporting features of Panorama Necto and Tableau Public
Feature
Panorama Necto
7.3
24 Ratings
11% below category average
Tableau Public
9.8
12 Ratings
19% above category average
Pixel Perfect reports
6.022 Ratings
9.710 Ratings
Customizable dashboards
8.024 Ratings
10.012 Ratings
Report Formatting Templates
8.024 Ratings
9.712 Ratings
Ad-hoc Reporting
Comparison of Ad-hoc Reporting features of Panorama Necto and Tableau Public
Feature
Panorama Necto
8.0
24 Ratings
0% below category average
Tableau Public
9.7
12 Ratings
21% above category average
Drill-down analysis
9.023 Ratings
9.812 Ratings
Formatting capabilities
7.024 Ratings
9.712 Ratings
Integration with R or other statistical packages
8.017 Ratings
9.59 Ratings
Report sharing and collaboration
8.022 Ratings
9.811 Ratings
Report Output and Scheduling
Comparison of Report Output and Scheduling features of Panorama Necto and Tableau Public
Feature
Panorama Necto
7.2
22 Ratings
13% below category average
Tableau Public
9.5
11 Ratings
15% above category average
Publish to Web
7.821 Ratings
10.011 Ratings
Publish to PDF
6.722 Ratings
10.09 Ratings
Report Versioning
7.116 Ratings
9.89 Ratings
Report Delivery Scheduling
7.021 Ratings
9.69 Ratings
Delivery to Remote Servers
00 Ratings
8.17 Ratings
Data Discovery and Visualization
Comparison of Data Discovery and Visualization features of Panorama Necto and Tableau Public
Panorama Necto 14 is well suited where BI is built to support social collaboration so that its analytics features can be shared to improve decision making by incorporating various organizational input. Additionally it supports an infographic display for information review which is unlike most of its competitors.
Tableau public is the best platform to build dashboards for your personal profile and share with recruiters. It's always good to keep ourselves updated on the latest features, create sample dashboards and save them to a personal profile. Tableau public is free and doesn't need any subscription. anyone can create an account and start building reports.
Comes with lot of option to modify and build the smart infographic. Uses innovative pictures and charts to create the dashboards
Helps you identify why you are succeeding and where you should shift your focus to.
The maps are amazing and they just don’t act as control points rather you can populate various measures on them making it really efficient to understand the business in geographical info graph
Data visualization: lots of different options, including bar, scatter, pie, waterfall charts to explore relationships between variables, and to present findings/trends to different teams
Integrates readily with limited, though different data sources: TXT, CSV, TDE, Access
Exports reports for review of different dashboards: client-ready/team-ready, with a clean and tidy presentation in PDF format (or hardcopy)
A de minimis incentive was given to thank the reviewer for their time. The incentive was not used to bias or drive a particular response, nor was the incentive contingent on a positive endorsement. More Info
This tool is relatively new to the current competitive BI market. Many organizations or business analyst are not yet aware of it's eye catching features.
Need more enhancement for predictive analysis.
Publishing reports as email attachment and mail server configuration is a little complicated process.
Tableau Public (both Desktop and Server) like their "for a fee" counterparts offer very easy to learn and use tools to transform data into pictures and gain insights into your data. Most organizations report a reduction in development time of 10x vs. other similar tools, due to the intuitive user interface. That said, with Tableau Public, published workbooks are "disconnected" from the underlying data sources and require periodic updates when the data changes. Users are limited to 1 Gb of storage space per user ID and password as well.
I would like to see better options for public sharing of visualizations and data from within the "for a fee" products as more and more organizations are moving in the direction of data sharing with partners and their communities.
A de minimis incentive was given to thank the reviewer for their time. The incentive was not used to bias or drive a particular response, nor was the incentive contingent on a positive endorsement. More Info
Some features are very basic and sometimes you can't add your own SQL query for custom reports. For Macs and Blackberry users this application is not helpful. Non-languages are not supported in info-graphics. They need to improve their forecast analysis. Report sharing is limited among the portal users only
It's free, right? I'll keep using the free version. So the real question to ask is this? Will I pay $999 for the Personal version or $1,999 for the Professional? Yikes! That is a big stretch. I'm not sure about that. The product comparison chart is at: http://www.tableausoftware.com/public/comparison
It provides all the features that are required and some that are not the basic requirements, but they represent a great additional capabilities, not available within the similar products
Tableau public is a great training tool to understand the basics of Tableau before buying it. A great tool to extend Excel's visualization and to publish data for others. Not useful for anything you need secure. No ability to access databases. Static information only.
A de minimis incentive was given to thank the reviewer for their time. The incentive was not used to bias or drive a particular response, nor was the incentive contingent on a positive endorsement. More Info
Start at the end and work backward. Identify the business case / issue and questions the end users have, then identify the data needed, and where to get it.
A de minimis incentive was given to thank the reviewer for their time. The incentive was not used to bias or drive a particular response, nor was the incentive contingent on a positive endorsement. More Info
This is the next generation BI tool, which will be very helpful for small and medium businesses to kick start data exploration and visualization of their diverse databases, with less intervention from IT. This tool is more end user centric and gives way more power to the end user to perform data analysis
Google Charts/Drive is sufficient for simpler data sets, but it does not integrate with other web platforms and the visualization does not look as professional. I'm not aware of any other competitors that offer the same package as Microsoft.
A de minimis incentive was given to thank the reviewer for their time. The incentive was not used to bias or drive a particular response, nor was the incentive contingent on a positive endorsement. More Info
A de minimis incentive was given to thank the reviewer for their time. The incentive was not used to bias or drive a particular response, nor was the incentive contingent on a positive endorsement. More Info