
QlikView vs. Scoop Analytics
| Product | Rating | Most Used By | Product Summary | Starting Price |
|---|---|---|---|---|
 QlikView | Score8.4 out of 10 | N/A | QlikView® is Qlik®’s original BI offering designed primarily for shared business intelligence reports and data visualizations. It offers guided exploration and discovery, collaborative analytics for sharing insight, and agile development and deployment. | N/A |
 Scoop Analytics | N/A | N/A | Scoop is offered as an AI data scientist that uses AI agents and real machine learning to uncover what’s happening in a business, explain why, and guide what to do next. Scoop is further described as an agentic system that finds patterns, segments, shifts, and predictors across sales, marketing, finance, and customer data without needing every variable up front. It does not need SQL, or Python. With connected data, Scoop surfaces insights on its… | $120 per year |
| QlikView | Scoop Analytics | |||||||||||||||
|---|---|---|---|---|---|---|---|---|---|---|---|---|---|---|---|---|
| Editions & Modules |
| No answers on this topic | ||||||||||||||
| Offerings |
| |||||||||||||||
| Entry-level Setup Fee | Optional | No setup fee | ||||||||||||||
| Additional Details | On an perpetual license basis, based on server plus number of users. Contact vendor for pricing. | — | ||||||||||||||
| More Pricing Information | ||||||||||||||||
| QlikView | Scoop Analytics | |
|---|---|---|
| Considered Both Products | No answer on this topic | No answer on this topic |
| Key User Insights | ||
| Would buy again | ||
93% Would buy again 13 Answers | No answers on this topic | |
| Delivers good value for the price | ||
100% Delivers good value for the price 14 Answers | No answers on this topic | |
| Happy with the feature set | ||
100% Happy with the feature set 14 Answers | No answers on this topic | |
| Lived up to sales and marketing promises | ||
89% Lived up to sales and marketing promises 8 Answers | No answers on this topic | |
| Implementation went as expected | ||
88% Implementation went as expected 7 Answers | No answers on this topic | |
| QlikView | Scoop Analytics | ||||||||||||||||
|---|---|---|---|---|---|---|---|---|---|---|---|---|---|---|---|---|---|
| BI Standard Reporting |
| ||||||||||||||||
| Ad-hoc Reporting |
| ||||||||||||||||
| Report Output and Scheduling |
| ||||||||||||||||
| Data Discovery and Visualization |
| ||||||||||||||||
| Access Control and Security |
| ||||||||||||||||
| Mobile Capabilities |
| ||||||||||||||||
| QlikView | Scoop Analytics | |
|---|---|---|
| Small Businesses |  Cyfe Score4 out of 10 |  Chartio (discontinued) Score7.5 out of 10 |
| Medium-sized Companies |  Zendesk Explore Score8.1 out of 10 |  Jet Reports Score9.5 out of 10 |
| Enterprises |  Sisense Score6.7 out of 10 |  SAP Lumira Discovery (legacy) Score8.6 out of 10 |
| All Alternatives | View all alternatives | View all alternatives |
| QlikView | Scoop Analytics | |
|---|---|---|
| Likelihood to Recommend | 7.6 | - |
| Likelihood to Renew | 8.8 | - |
| Usability | 8.0 | - |
| Availability | 9.8 | - |
| Performance | 8.6 | - |
| Support Rating | 3.3 | - |
| Online Training | 8.0 | - |
| Implementation Rating | 7.4 | - |
| Data Sharing and Collaboration | 7.8 | - |
| Data Sources | 7.8 | - |
| Product Scalability | 8.9 | - |
| QlikView | Scoop Analytics | |
|---|---|---|
| Likelihood to Recommend |
| No answers on this topic |
| Pros |
| No answers on this topic |
| Cons |
| No answers on this topic |
| Likelihood to Renew |
| No answers on this topic |
| Usability |
| No answers on this topic |
| Reliability and Availability |
| No answers on this topic |
| Performance |
| No answers on this topic |
| Support Rating |
| No answers on this topic |
| In-Person Training |
| No answers on this topic |
| Online Training |
| No answers on this topic |
| Implementation Rating |
| No answers on this topic |
| Alternatives Considered |
| No answers on this topic |
| Return on Investment |
| No answers on this topic |
| ScreenShots | QlikView Screenshots 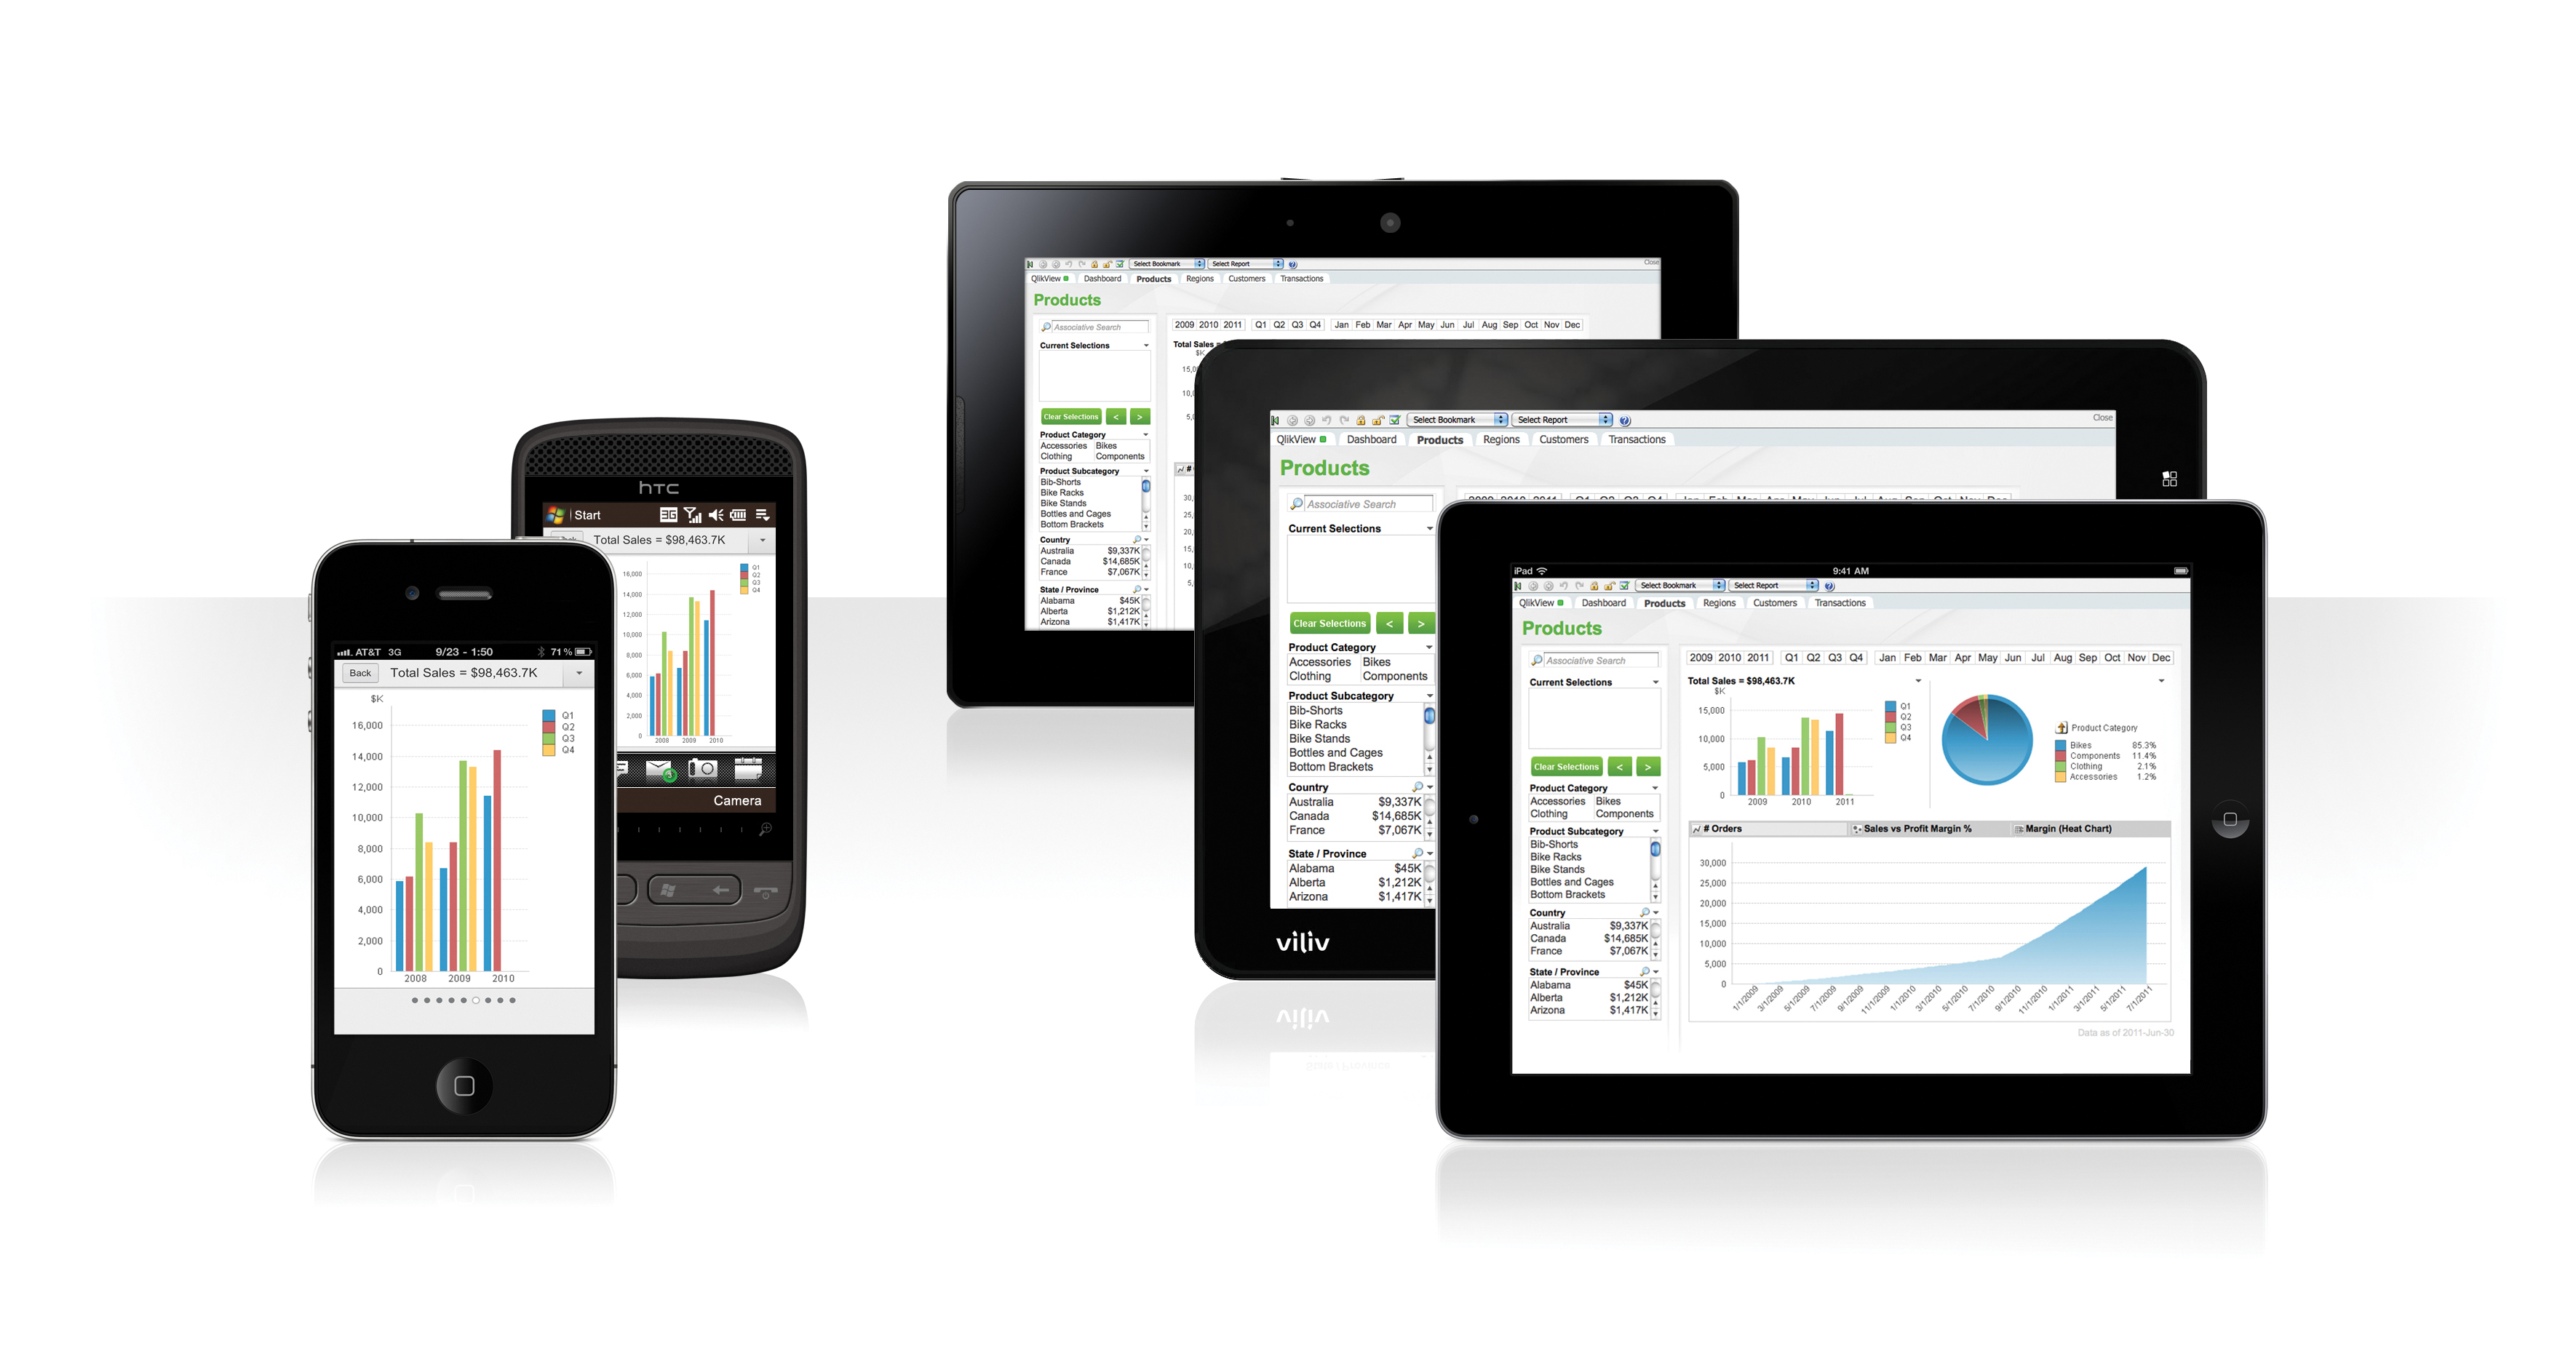 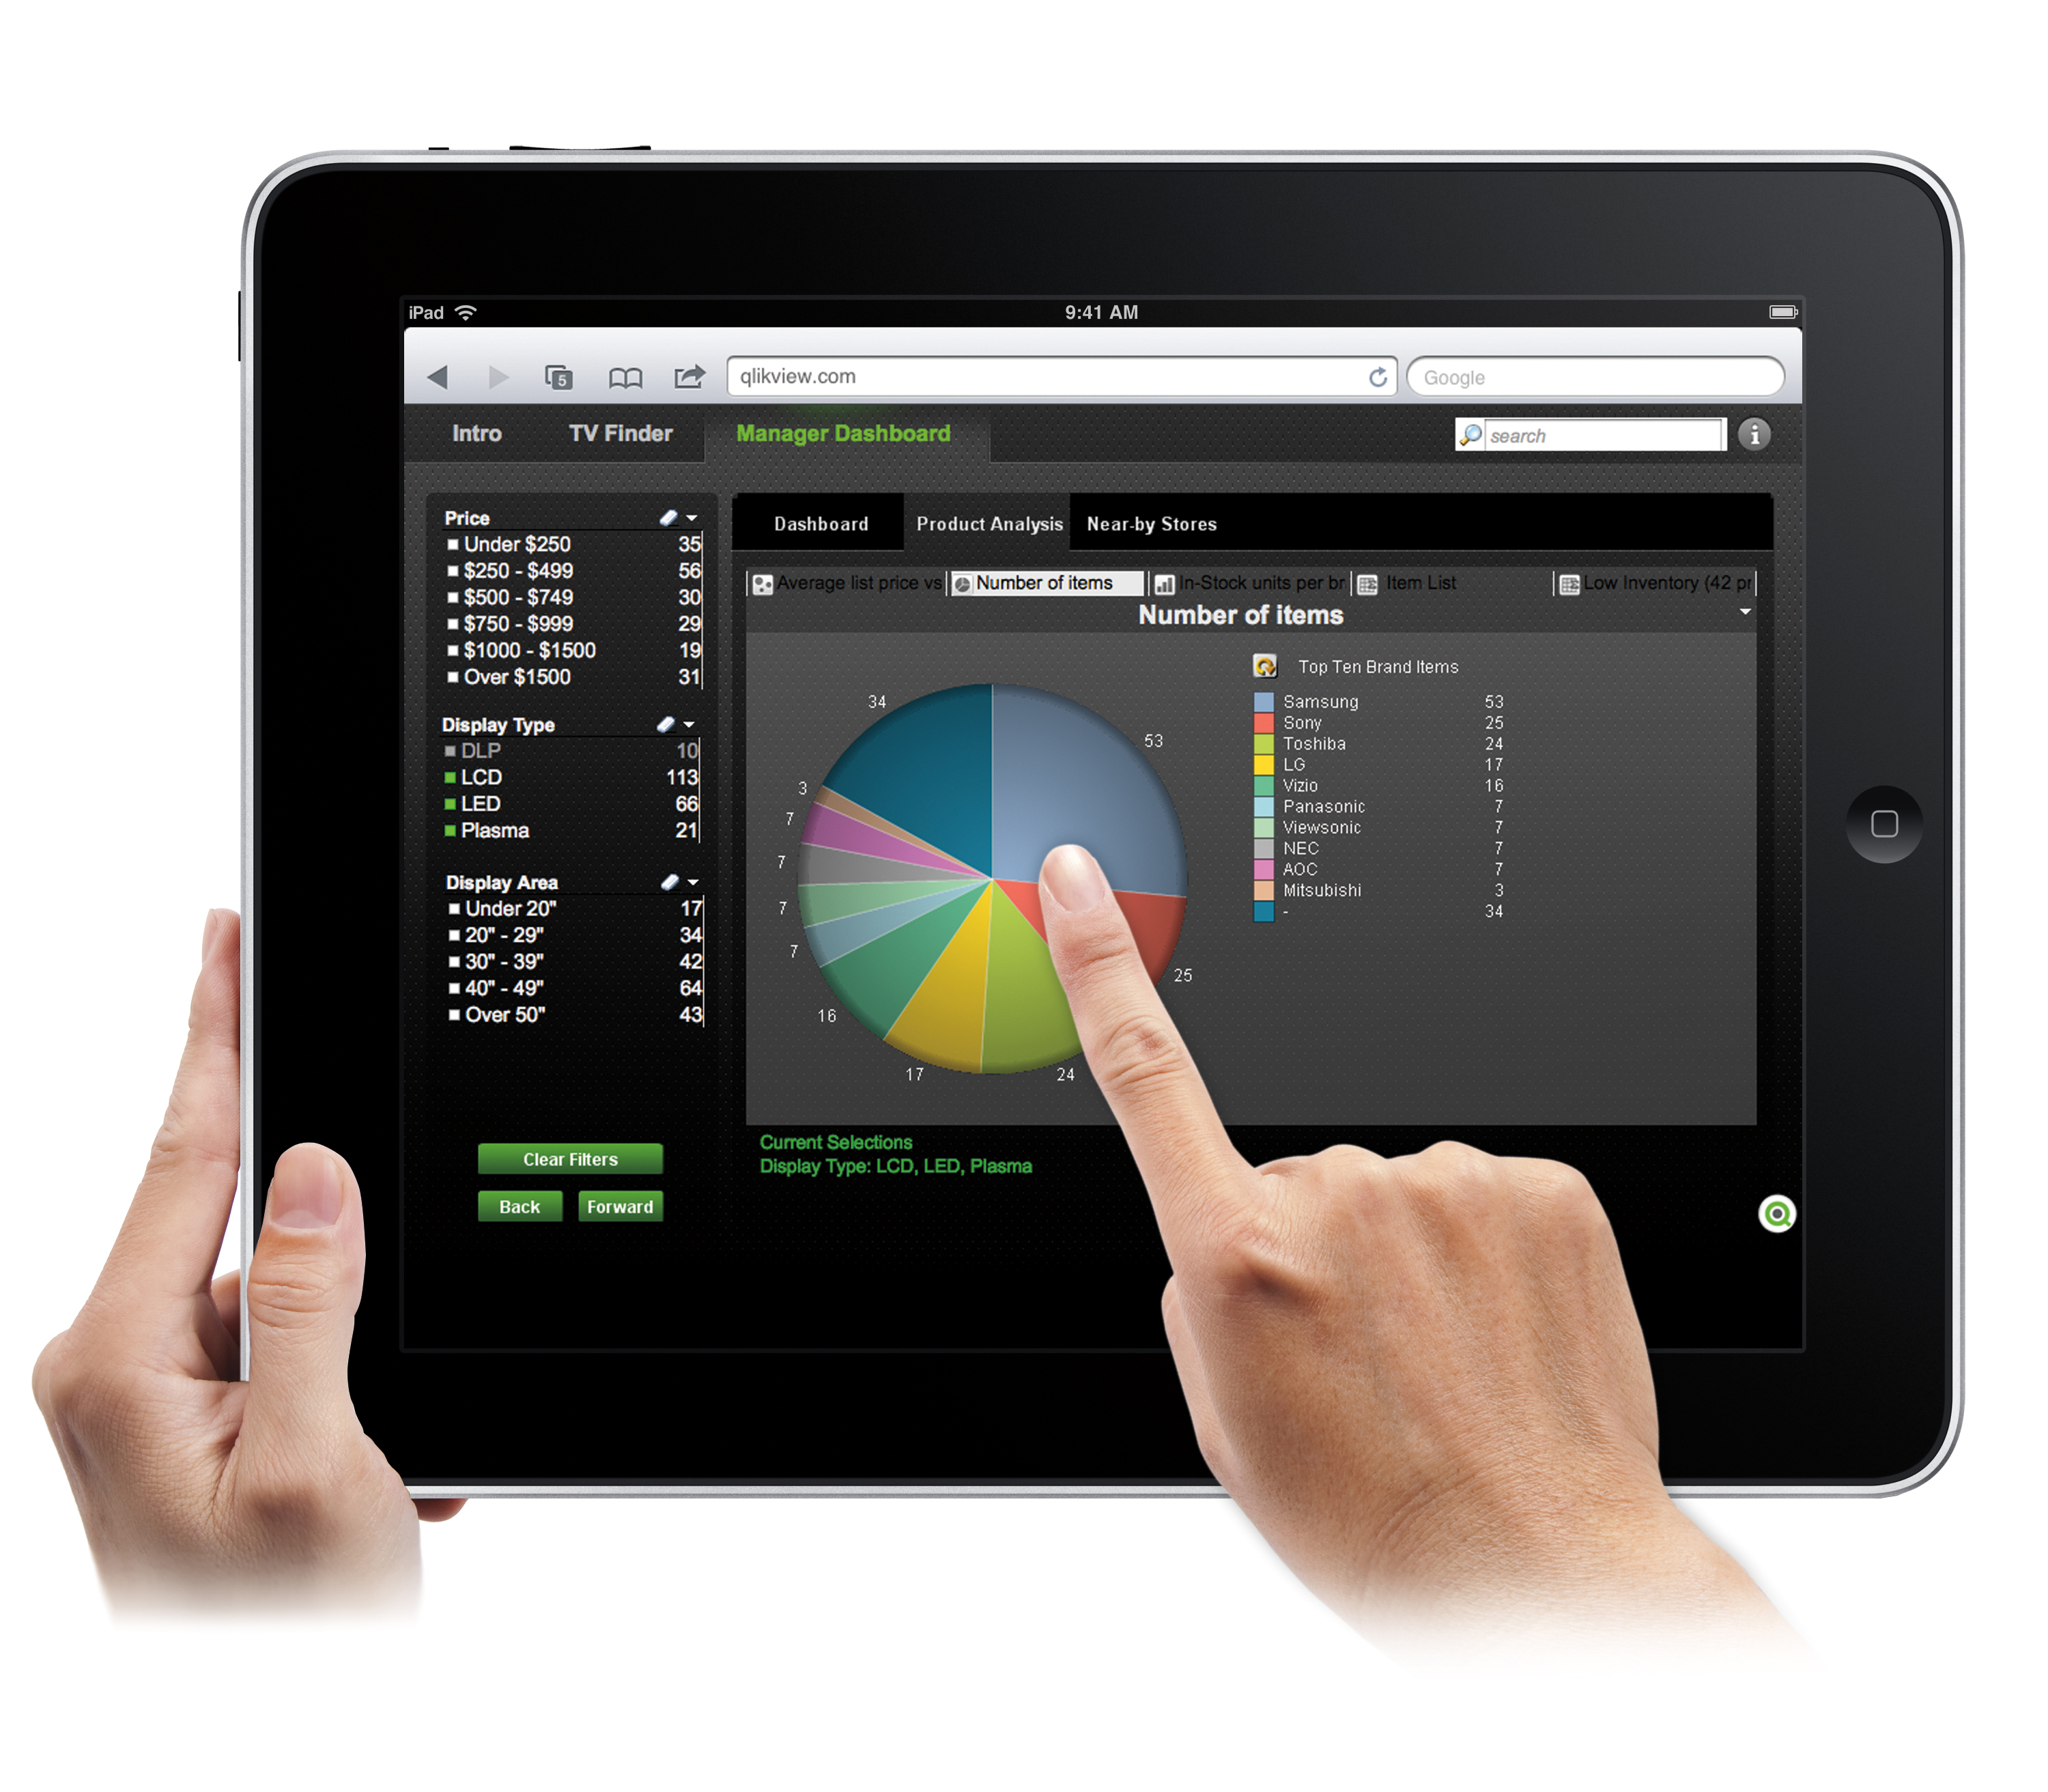 |


