
QlikView vs. Tray.ai
| Product | Rating | Most Used By | Product Summary | Starting Price |
|---|---|---|---|---|
 QlikView | Score8.4 out of 10 | N/A | QlikView® is Qlik®’s original BI offering designed primarily for shared business intelligence reports and data visualizations. It offers guided exploration and discovery, collaborative analytics for sharing insight, and agile development and deployment. | N/A |
 Tray.ai | Score8.9 out of 10 | N/A | Tray.ai is a unified, enterprise-grade cloud orchestration and integration platform that combines modern Integration Platform as a Service (iPaaS) capabilities with advanced AI-agent development and Model Context Protocol (MCP) governance. Built on a low-code, visual workflow architecture, the platform enables organizations to connect disparate enterprise software applications, automate data-intensive processes, and build secure autonomous agents that operate on enterprise data. | N/A |
| QlikView | Tray.ai | |||||||||||||||
|---|---|---|---|---|---|---|---|---|---|---|---|---|---|---|---|---|
| Editions & Modules |
| No answers on this topic | ||||||||||||||
| Offerings |
| |||||||||||||||
| Entry-level Setup Fee | Optional | No setup fee | ||||||||||||||
| Additional Details | On an perpetual license basis, based on server plus number of users. Contact vendor for pricing. | — | ||||||||||||||
| More Pricing Information | ||||||||||||||||
| QlikView | Tray.ai | |
|---|---|---|
| Considered Both Products | No answer on this topic | No answer on this topic |
| Key User Insights | ||
| Would buy again | ||
93% Would buy again 13 Answers | No answers on this topic | |
| Delivers good value for the price | ||
100% Delivers good value for the price 14 Answers | No answers on this topic | |
| Happy with the feature set | ||
100% Happy with the feature set 14 Answers | No answers on this topic | |
| Lived up to sales and marketing promises | ||
89% Lived up to sales and marketing promises 8 Answers | No answers on this topic | |
| Implementation went as expected | ||
88% Implementation went as expected 7 Answers | No answers on this topic | |
| QlikView | Tray.ai | |||||||||||||||||||
|---|---|---|---|---|---|---|---|---|---|---|---|---|---|---|---|---|---|---|---|---|
| BI Standard Reporting |
| |||||||||||||||||||
| Ad-hoc Reporting |
| |||||||||||||||||||
| Report Output and Scheduling |
| |||||||||||||||||||
| Data Discovery and Visualization |
| |||||||||||||||||||
| Access Control and Security |
| |||||||||||||||||||
| Mobile Capabilities |
| |||||||||||||||||||
| Cloud Data Integration |
| |||||||||||||||||||
| QlikView | Tray.ai | |
|---|---|---|
| Small Businesses |  Cyfe Score4 out of 10 |  Make Score9.3 out of 10 |
| Medium-sized Companies |  Qlik Cloud Analytics (Qlik Sense) Score8.1 out of 10 |  IBM App Connect Score9 out of 10 |
| Enterprises |  Sisense Score6.9 out of 10 |  Workato Score9.3 out of 10 |
| All Alternatives | View all alternatives | View all alternatives |
| QlikView | Tray.ai | |
|---|---|---|
| Likelihood to Recommend | 7.6 | 10.0 |
| Likelihood to Renew | 8.8 | - |
| Usability | 8.0 | - |
| Availability | 9.8 | - |
| Performance | 8.6 | - |
| Support Rating | 3.3 | - |
| Online Training | 8.0 | - |
| Implementation Rating | 7.4 | - |
| Data Sharing and Collaboration | 7.8 | - |
| Data Sources | 7.8 | - |
| Product Scalability | 8.9 | - |
| QlikView | Tray.ai | |
|---|---|---|
| Likelihood to Recommend |
|
|
| Pros |
|
|
| Cons |
|
|
| Likelihood to Renew |
| No answers on this topic |
| Usability |
| No answers on this topic |
| Reliability and Availability |
| No answers on this topic |
| Performance |
| No answers on this topic |
| Support Rating |
| No answers on this topic |
| In-Person Training |
| No answers on this topic |
| Online Training |
| No answers on this topic |
| Implementation Rating |
| No answers on this topic |
| Alternatives Considered |
| No answers on this topic |
| Return on Investment |
|
|
| ScreenShots | QlikView Screenshots 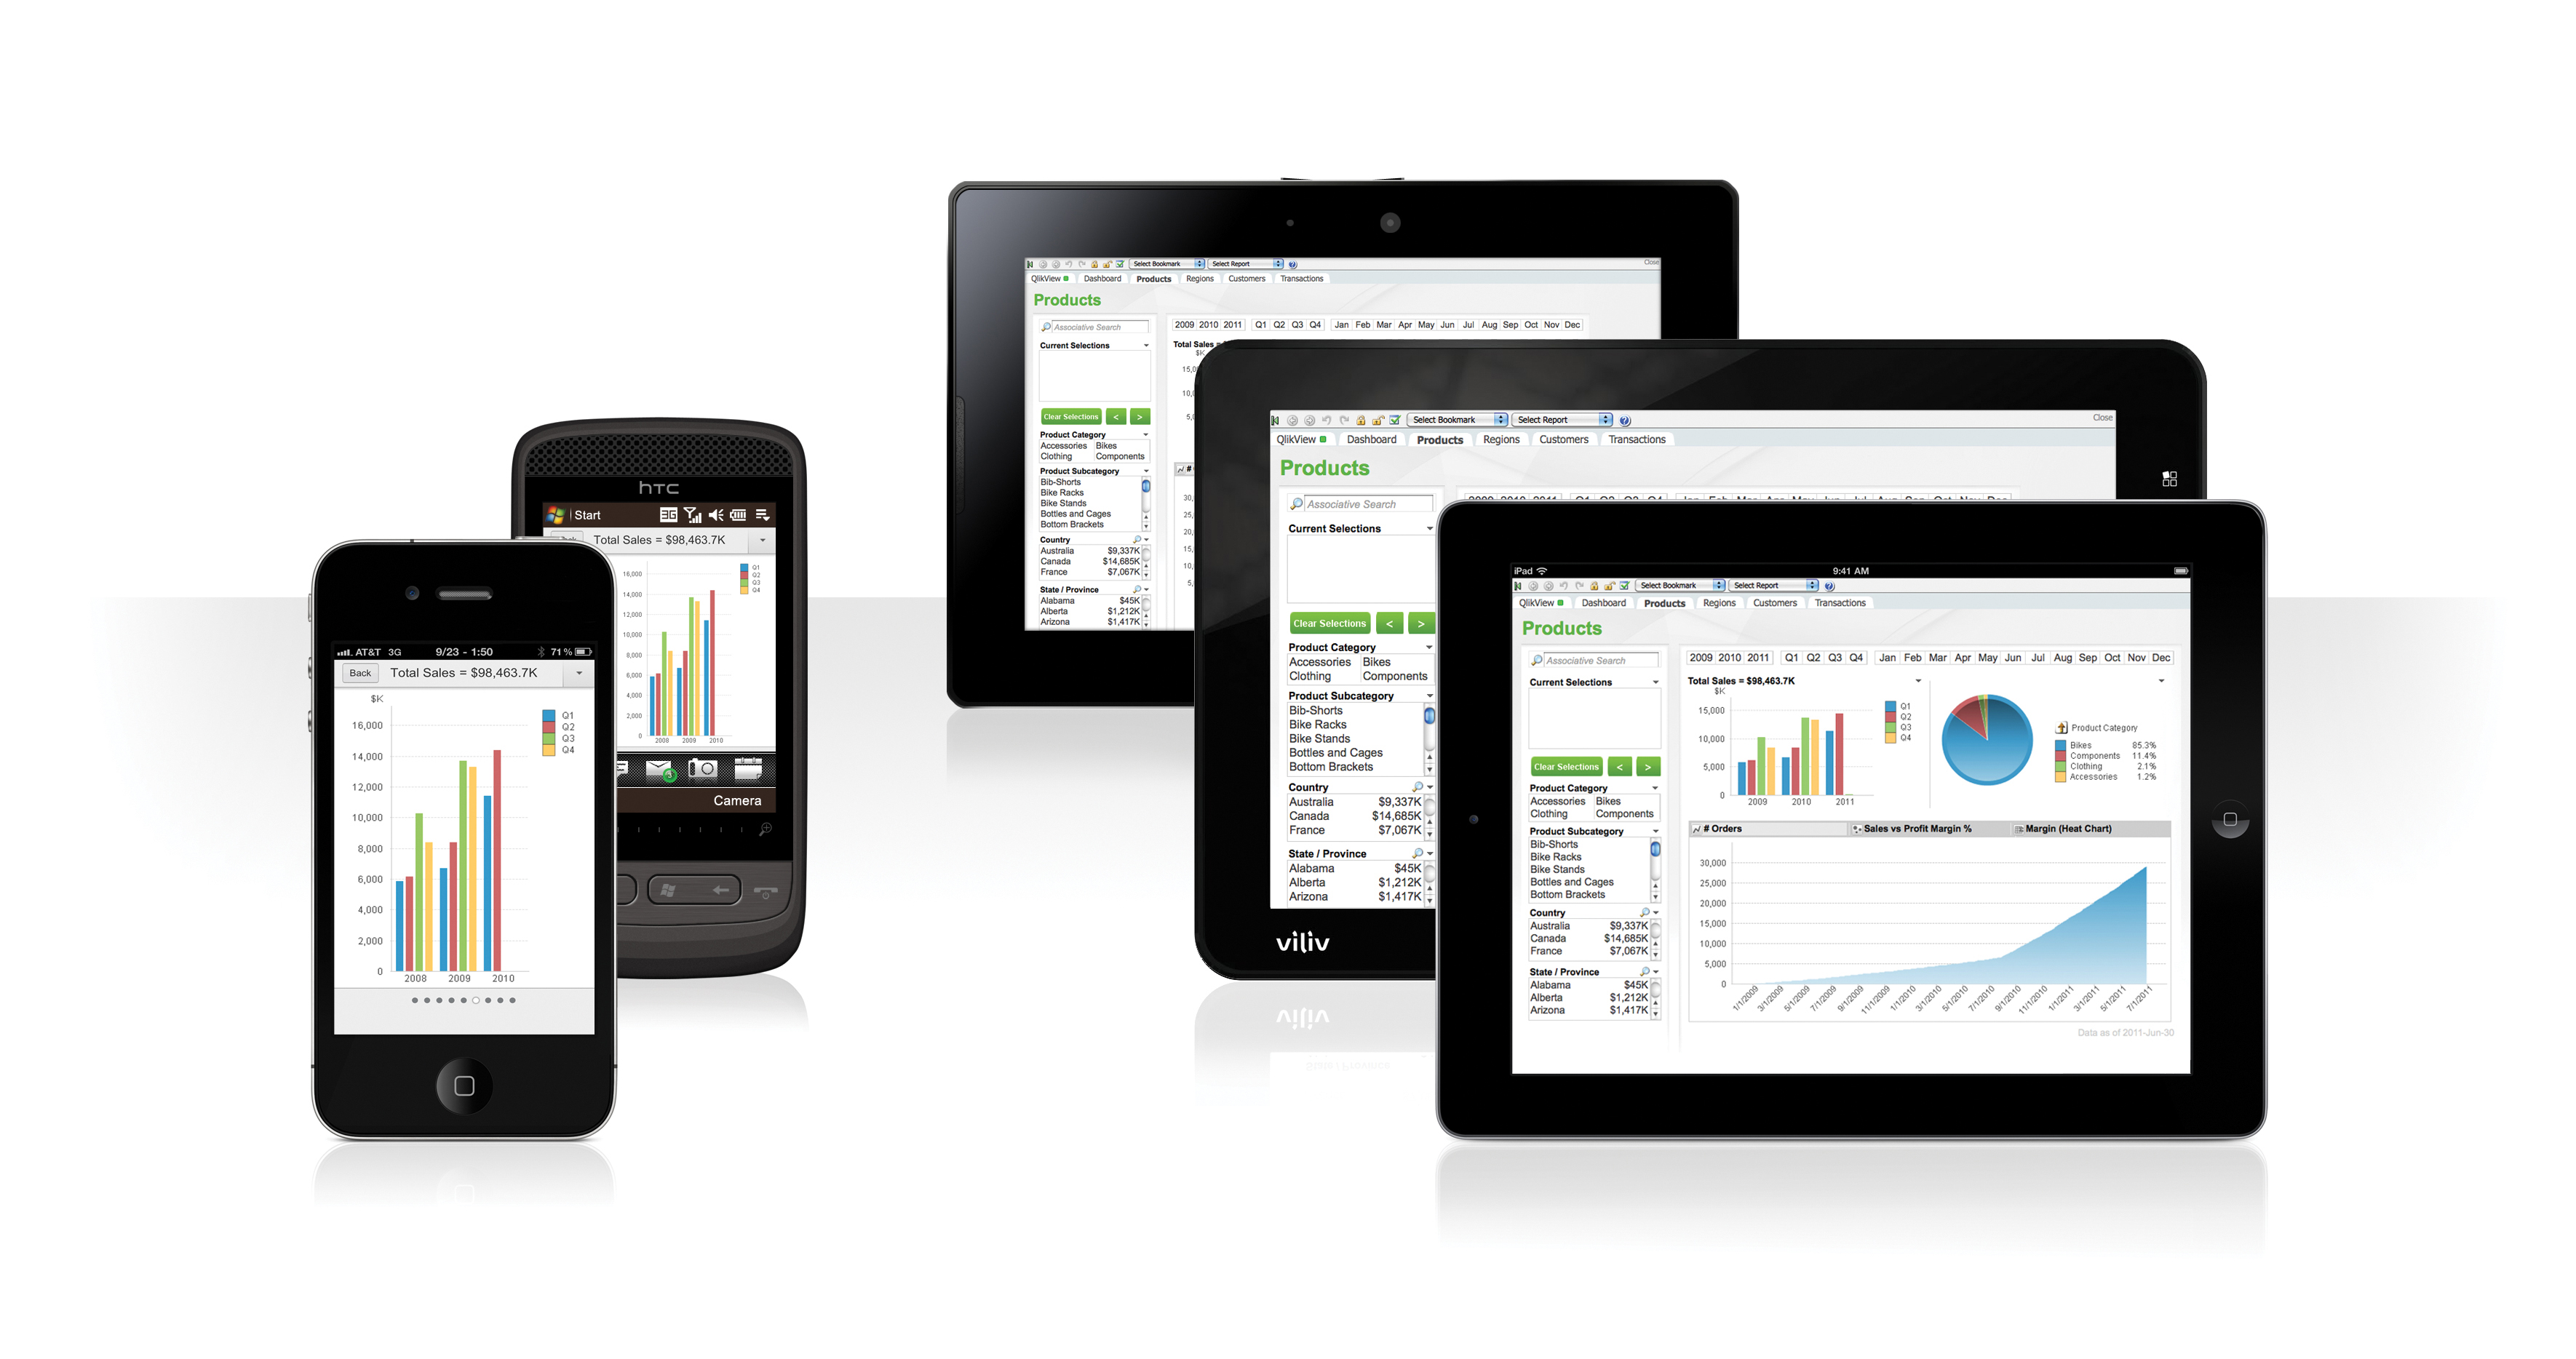 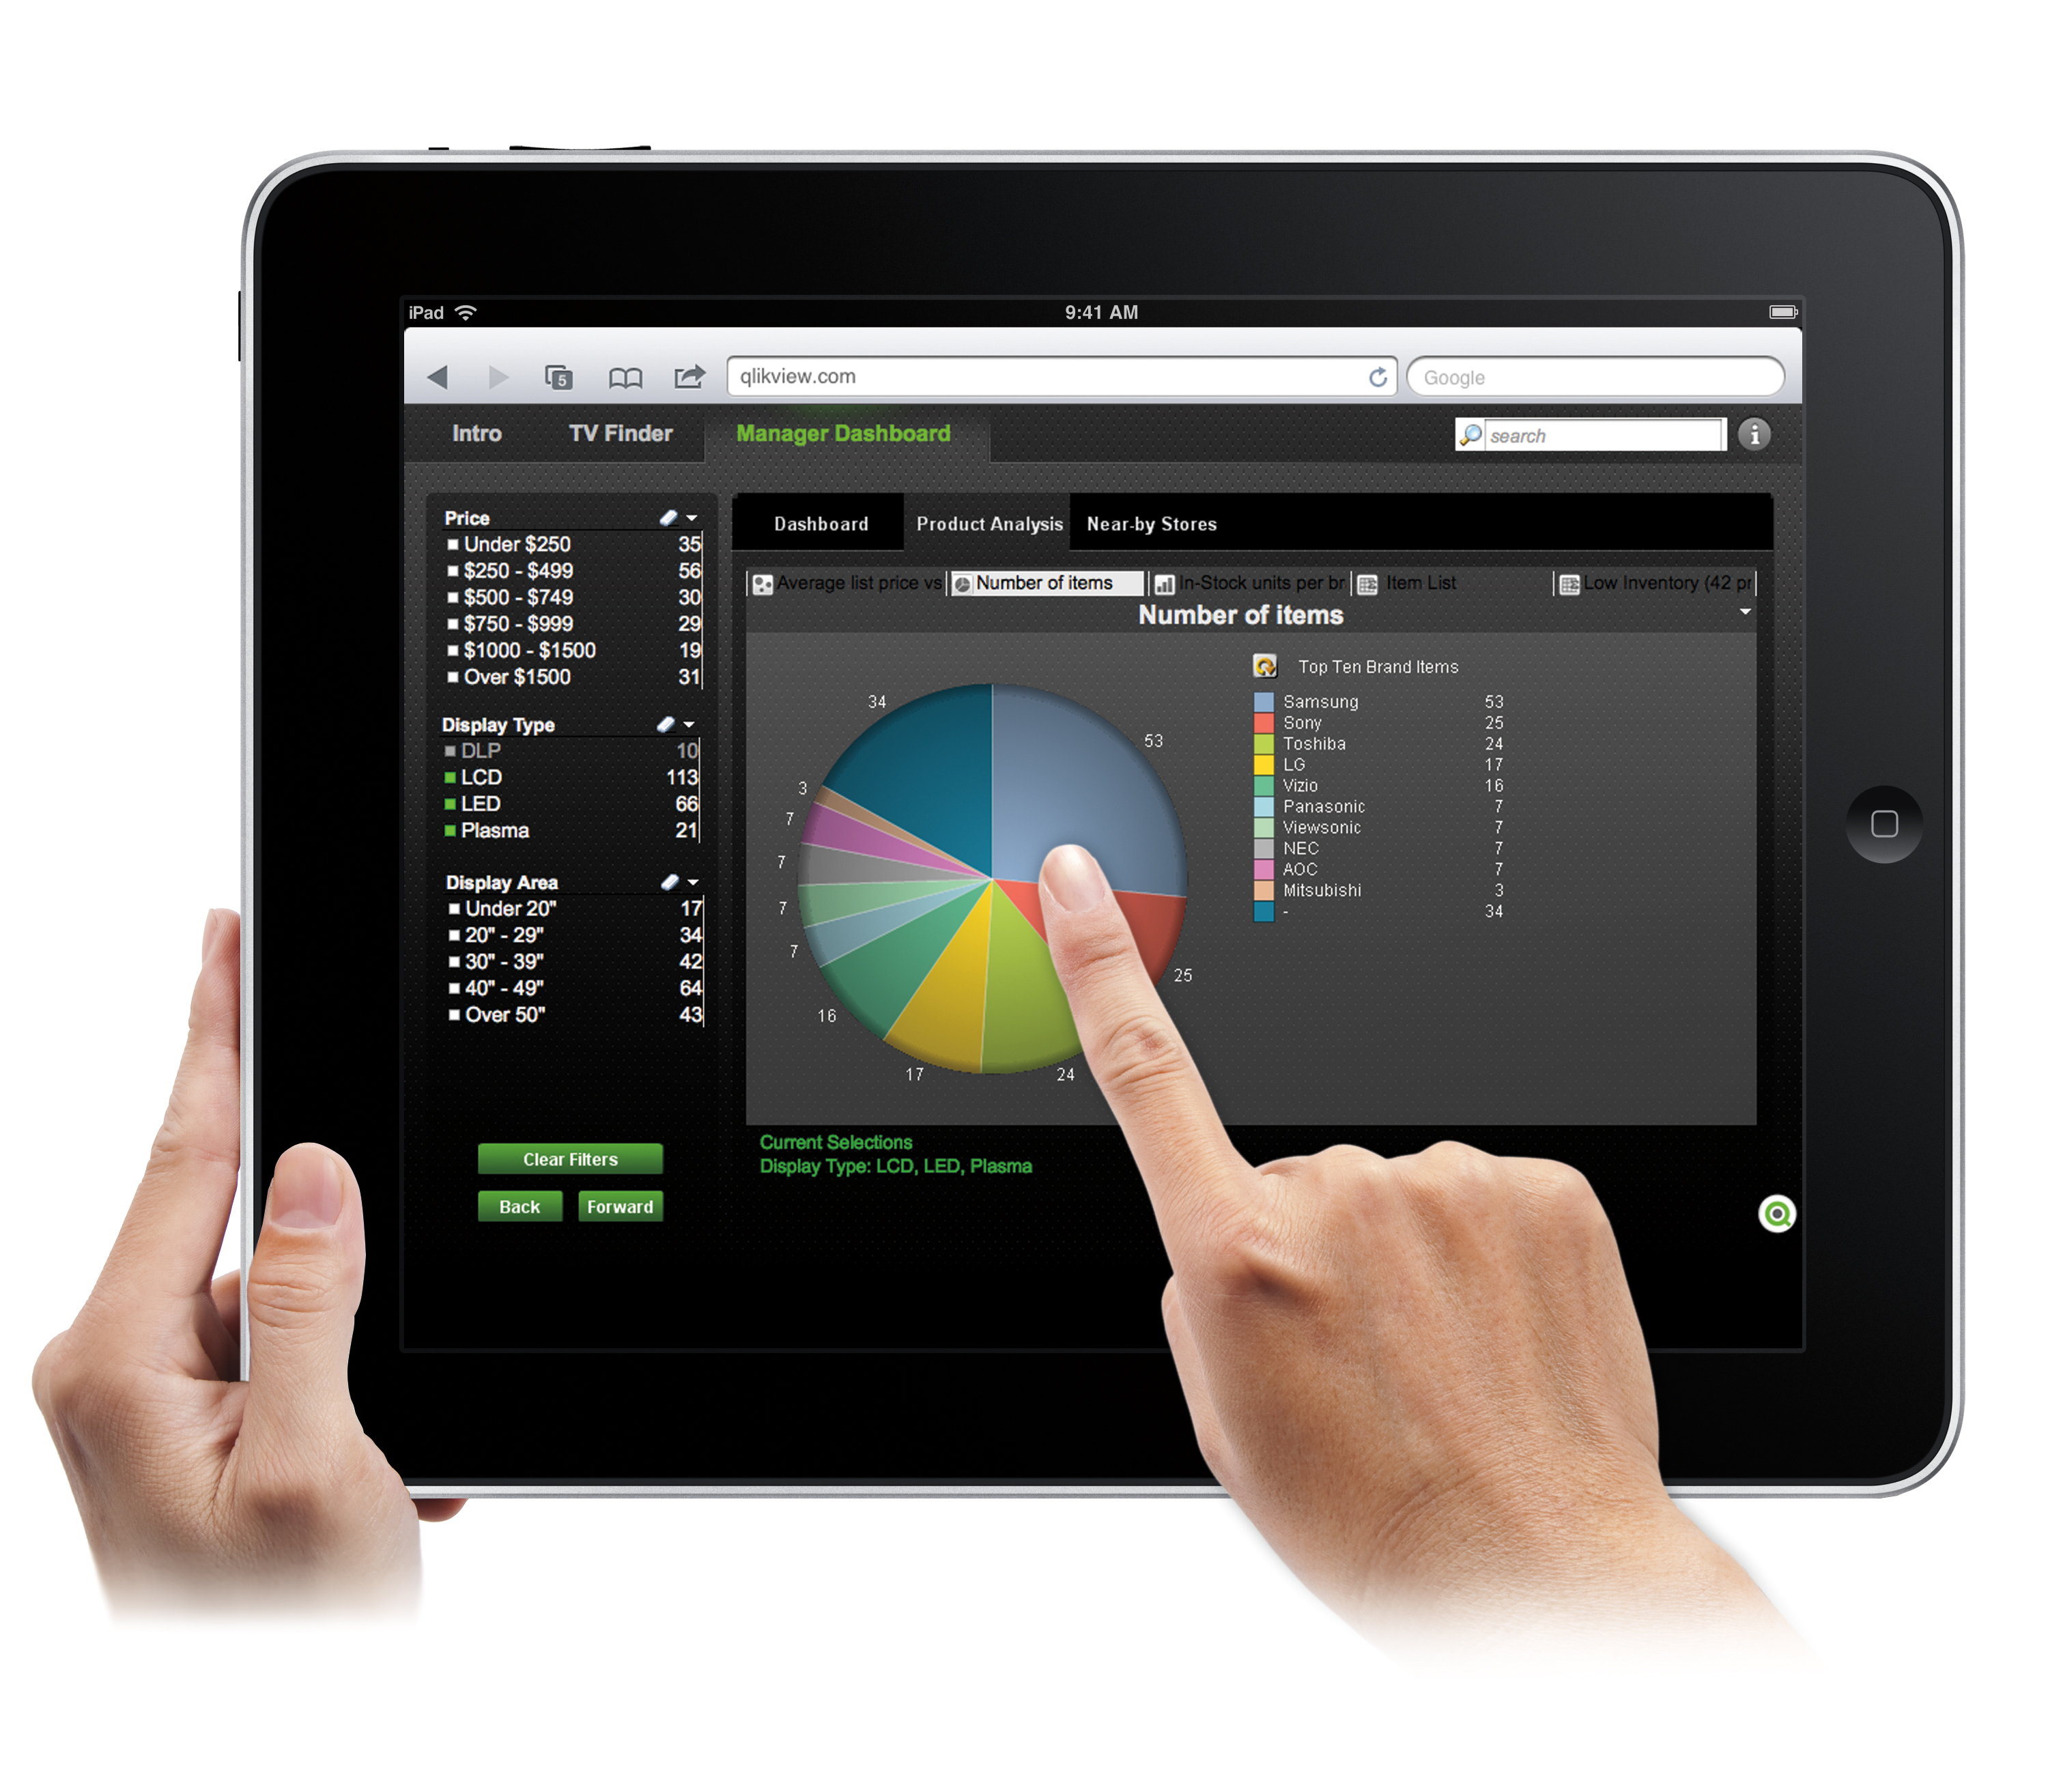 |


