SolarWinds® Virtualization Manager (VMAN) is a tool for monitoring, performance management, capacity planning and optimization for on-premises or cloud-based virtual environments. It also integrates with other SolarWinds products.
N/A
SonarQube
Score 8.1 out of 10
N/A
SonarQube is an automated code review solution, serving as the verification layer for code quality and SDLC security. SonarQube is used to ensure that code is secure, reliable, and maintainable. It is available through SaaS or self-managed deployment.
On the whole, Solarwinds Virtualization Manager (VMAN) is an excellent product which gives us a single point to monitor our virtual environment. After our initial trial I was sold on the product and what it had to offer. Immediately after implementing VMAN, we were able to spot virtual machines with old snapshots which were never deleted and no longer needed, we could spot virtual machines which either had over allocated resources or under allocated resources meaning we could make changes and fine tune them for best performance. We could also monitor virtual machine latency, IOPS, and show us where our bottlenecks were.
SonarQube is excellent if you start using it at the beginning when developing a new system, in this situation you will be able to fix things before they become spread and expensive to correct. It’s a bit less suitable to use on existing code with bad design as it’s usually too expensive to fix everything and only allows you to ensure the situation doesn’t get worse.
I created custom dashboards, to view the different elements of the virtual environment. For example, you can view the number of online VMs and those off, or disconnected. You can also choose to see the status of every virtual cluster, the storage disk usage on every VM, the RAM usage, CPU usage.
I used this application to see the growth of virtual memory in each cluster and accordingly do forecasting for future growth. A capacity planner included in this application would help in doing accurate estimations and setting a future upgrade budget.
Another powerful tool was the customized reports, where i could generate reports on any element of the VM or cluster. Reports can be exported to Excel or PDF and are very useful for sharing information with colleagues and management.
Alerts can be customized. For example, you can set a rule to get an email alert if any virtual server RAM usage exceeds 85% and send a text message if RAM usage exceeds 90% for more than 10 minutes.
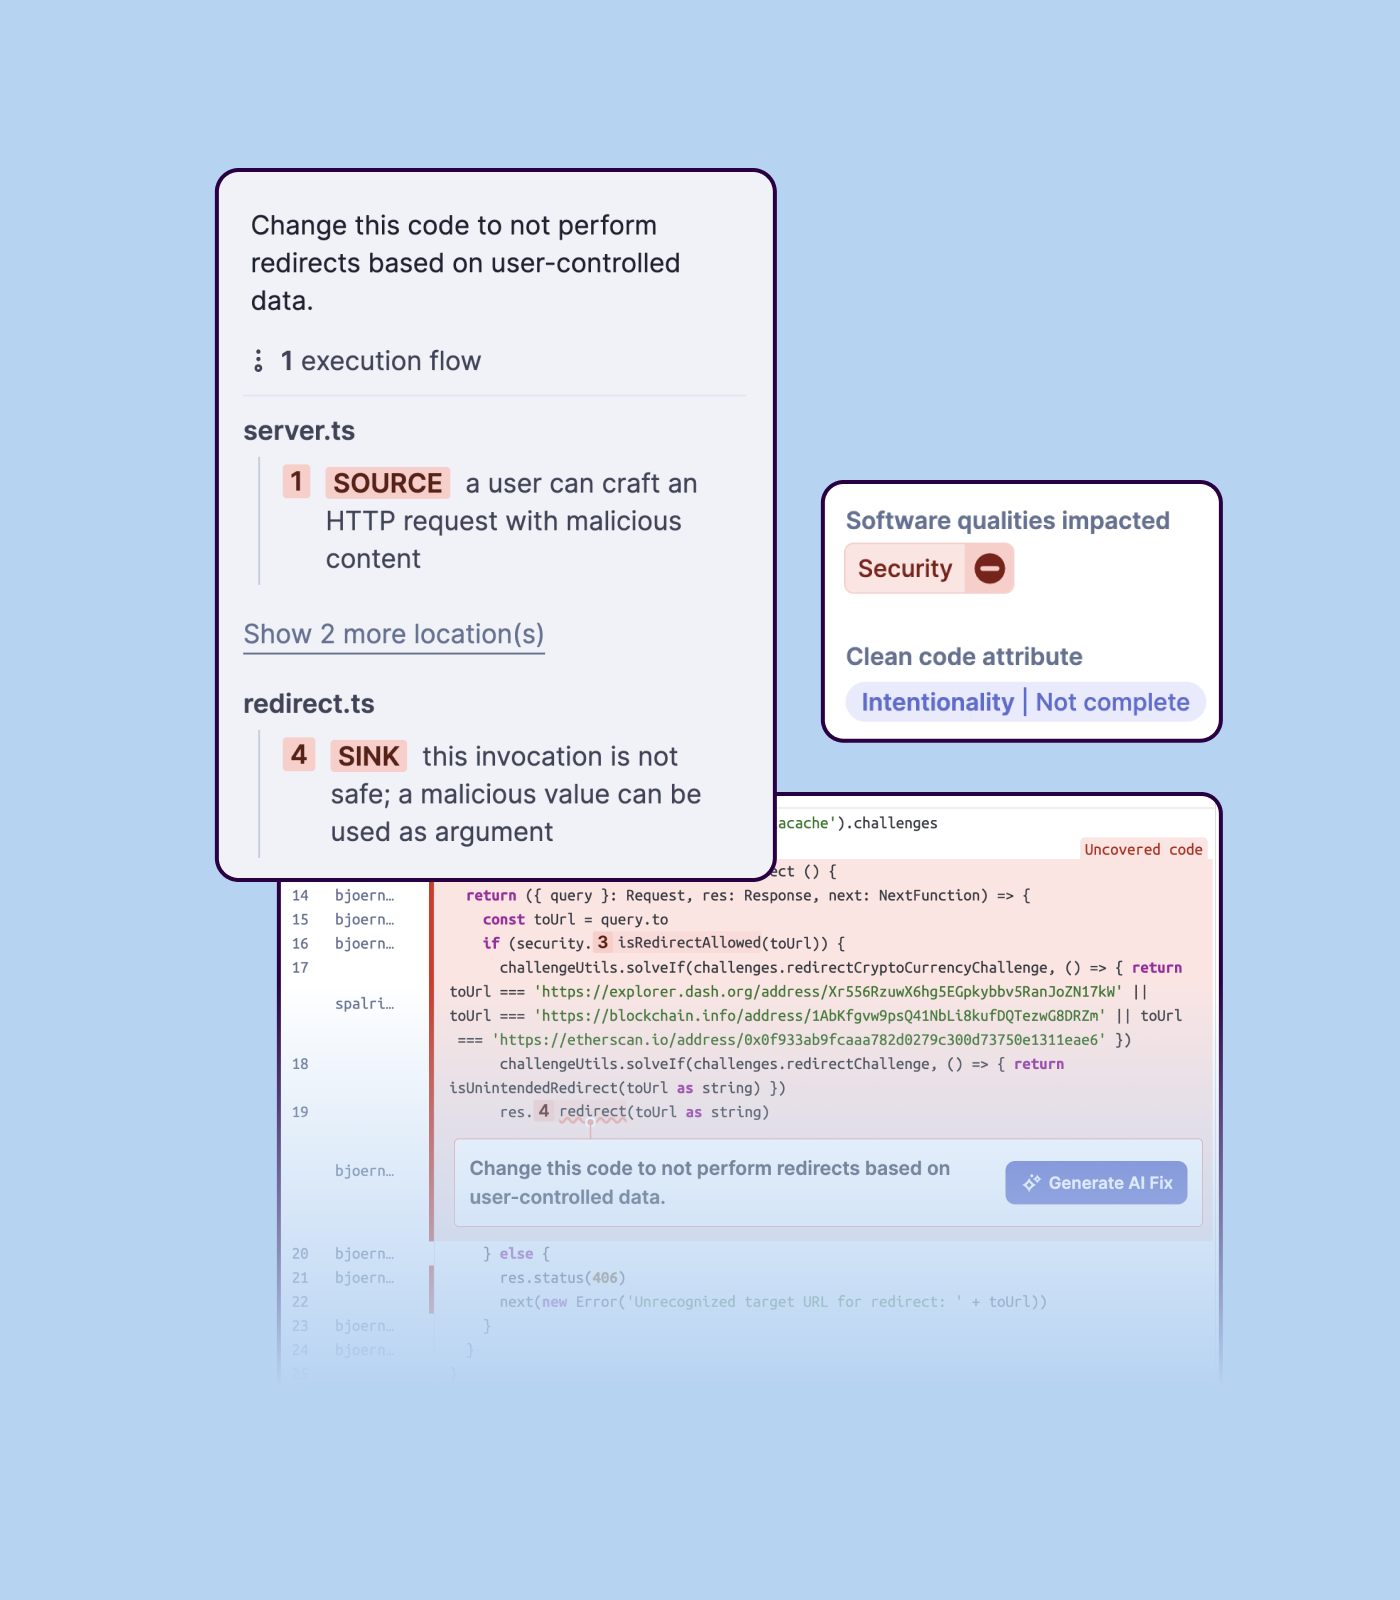
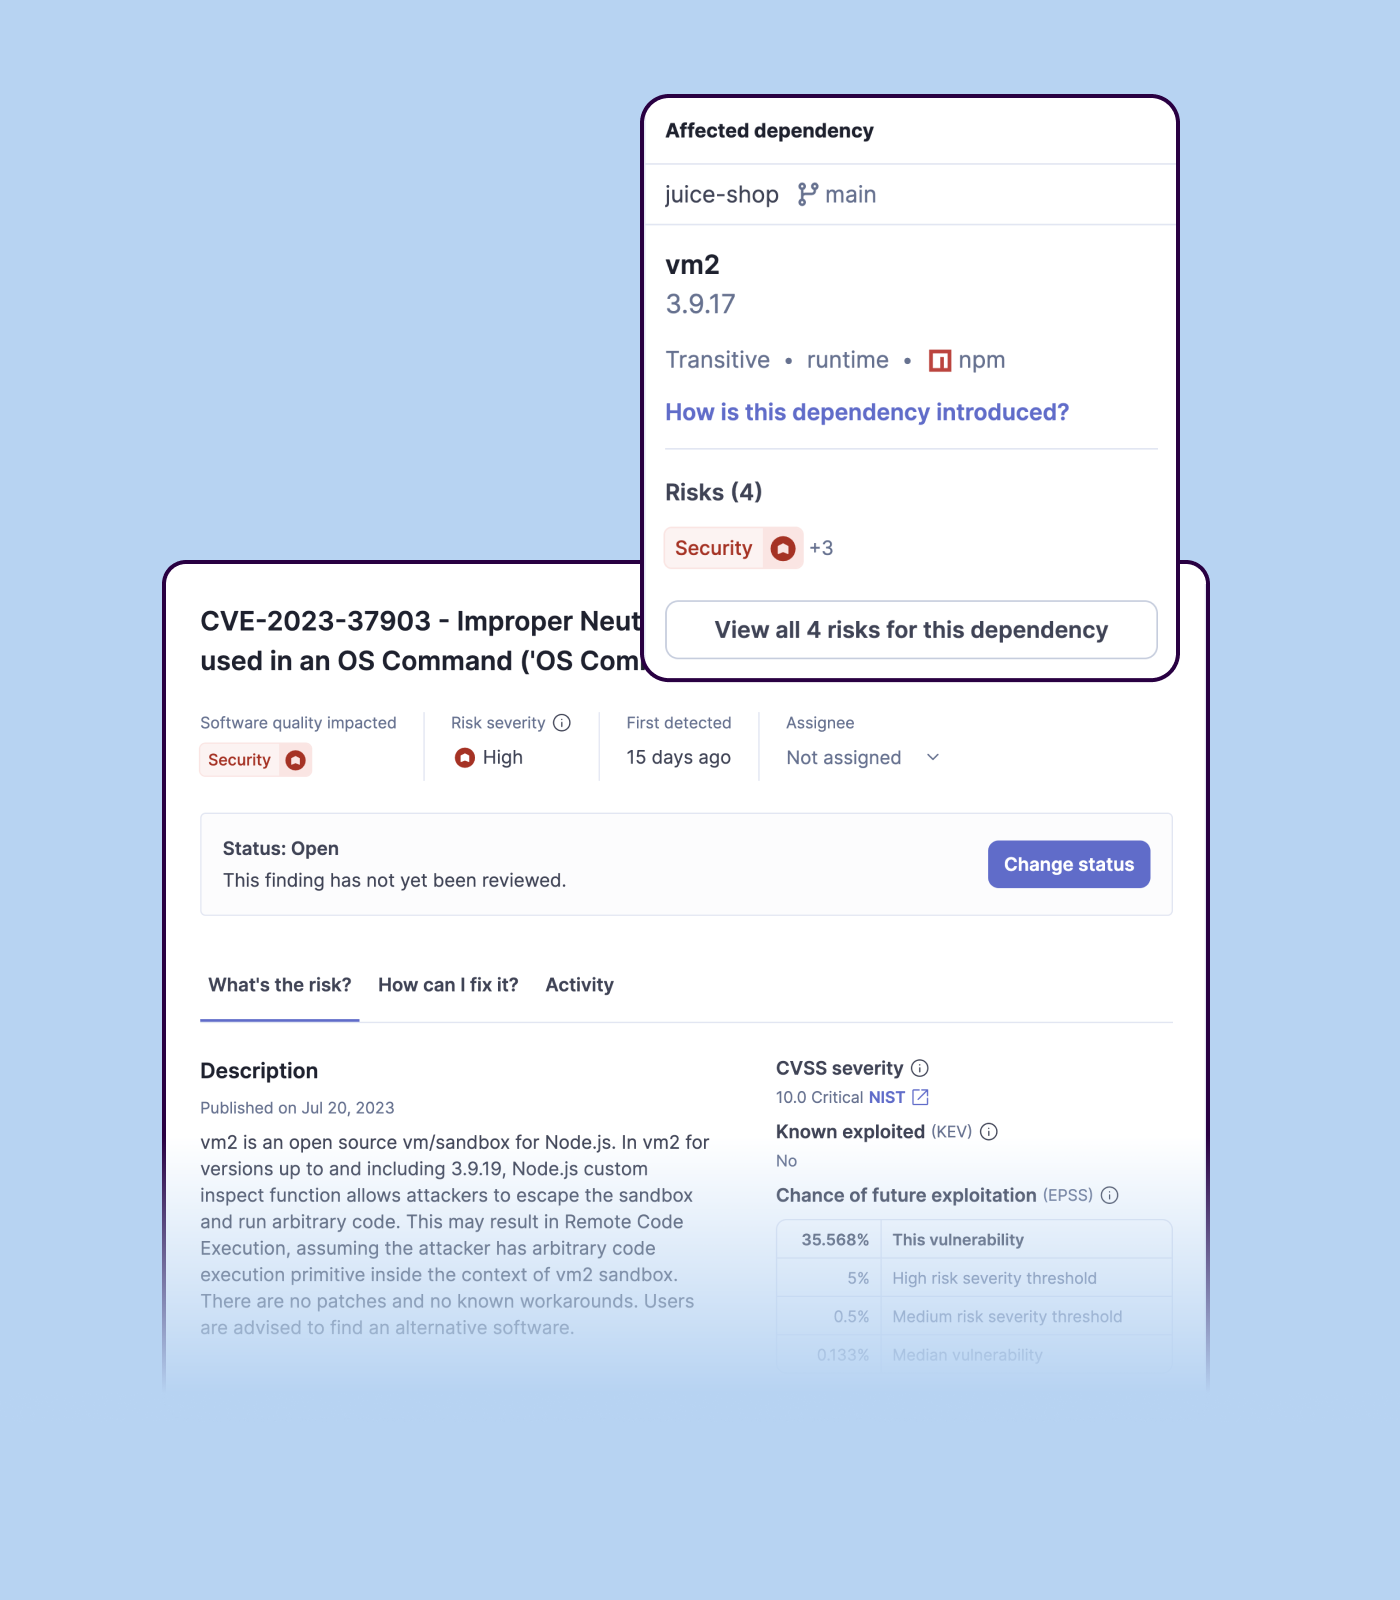
Detecting bugs and vulnerabilities: SonarQube can identify a wide range of bugs and vulnerabilities in code, such as null pointer exceptions, SQL injection, and cross-site scripting (XSS) attacks. It uses static analysis to analyze the code and identify potential issues, and it can also integrate with dynamic analysis tools to provide even more detailed analysis.
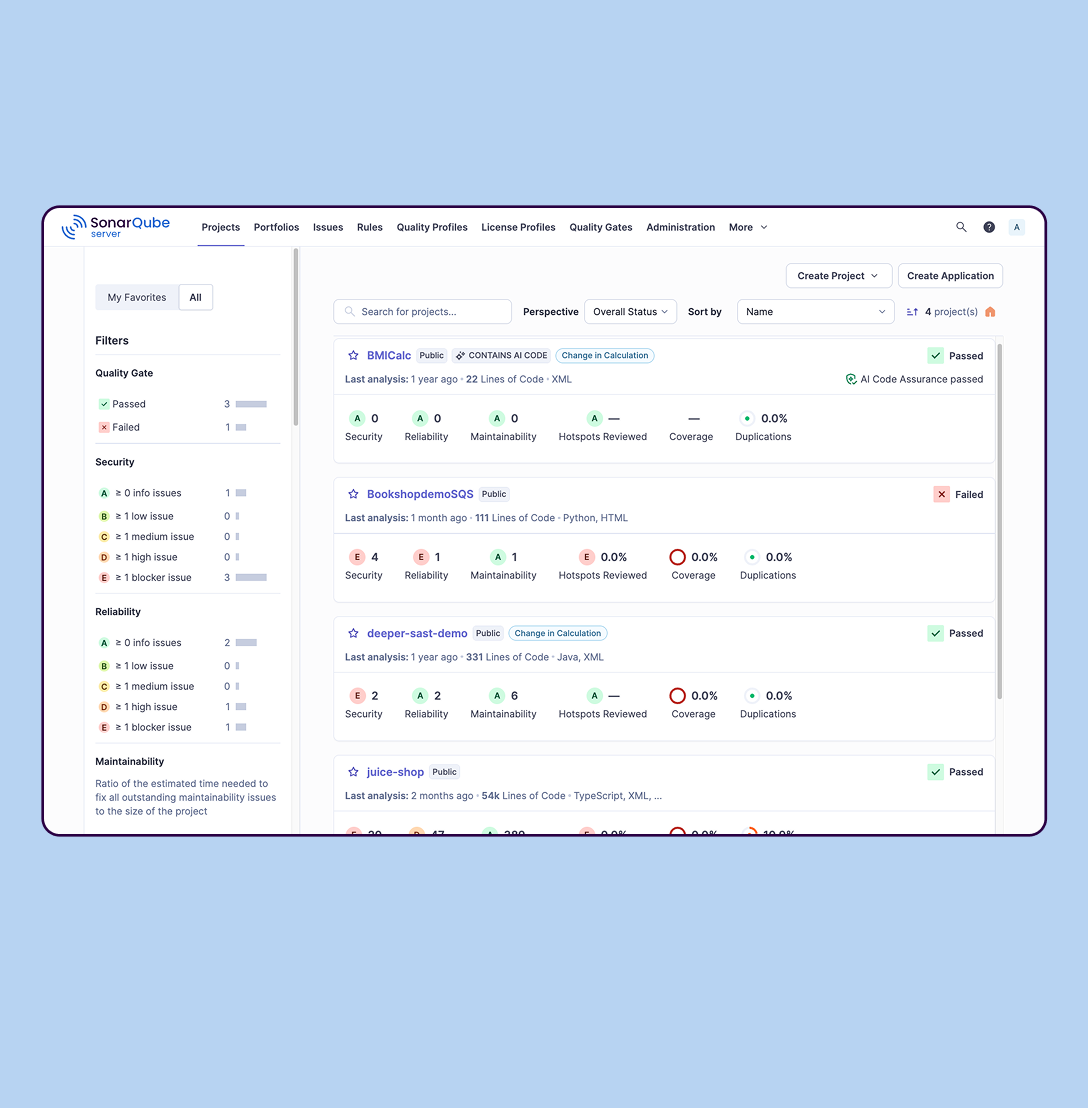
Measuring code quality: SonarQube can measure a wide range of code quality metrics, such as cyclomatic complexity, duplicated code, and code coverage. This can help teams understand the quality of their code and identify areas that need improvement.
Providing actionable insights: SonarQube provides detailed information about issues in the code, including the file and line number where the issue occurs and the severity of the issue. This makes it easy for developers to understand and address issues in the code.
Integrating with other tools: SonarQube can be integrated with a wide range of development tools and programming languages, such as Git, Maven, and Java. This allows teams to use SonarQube in their existing development workflow and take advantage of its powerful code analysis capabilities.
Managing technical debt: SonarQube provides metrics and insights on the technical debt on the codebase, enabling teams to better prioritize issues to improve the quality of the code.
Compliance with coding standards: SonarQube can check the code against industry standards like OWASP, CWE and more, making sure the code is compliant with security and coding standards.
We did have issues during the setup, with successfully connecting to some of our hosts and vCenters and we found support were just sending us back to articles we had already read, it was also taking long periods before getting a response. The issue is still ongoing, in fact.
Importing a new custom quality profile on SonarQube is a bit tricky, it can be made easier
Every second time when we want to rerun the server, we have to restart the whole system, otherwise, the server stops and closes automatically
When we generate a new report a second time and try to access the report, it shows details of the old report only and takes a lot of time to get updated with the details of the new and fresh report generated
Currently, there is no other tool that gives us what we need to monitor a geographically disperse environment with multiple non-related instances of VM clusters. In addition, the level of reporting, historical data trending, and alerting that VMAN provides is essential for our business process. Lastly, the effort to customize and set up any monitoring system is not trivial. This makes switching to any other product very difficult without being able to clearly demonstrate a ROI.
SolarWinds VMAN is easy to use for everyone. When I say everyone which literally means anyone e.g. Virtualization Environment SME, Consultant, Support Team, Management Officers etc. Anyone who have worked on IT technologies could easily deploy SolarWinds by reading videos, Thwack posts or Virtual Classrooms (Custom Success Centers) - this makes this application easy to operation and for maintenance support is always there.
SolarWinds gives good support. I have never had a time when i was working through a support case where I did not get the support I needed for the required issues to be resolved. I have always had resolutions from SolarWinds support. They are top notch. Issues once had are no more.
We we easily able to integrate the SonarQube steps into our TFS process via the Microsoft Marektplace, we didn't have the need to call SonarQube support. We've used their online documentation and community forum if we ran into any issues.
Its really the best product on the market for someone looking to have total control over their VM environment. anyone interested should download a demo and try it, I know you will buy it after you do. It changing the way you have to manage on a daily basis
The operation began using Nagios XI, after a year of use, and based on the results obtained, we realized that what our client wanted was not fully met. Our client asked us to use WhatsUp, however, SolarWinds covered in a more efficient way what was required by our client (IT) and even more.
SonarQube is an open-source. It's a scalable product. The costs for this application, for the kind of job it does, are pretty descent. Pipeline scan is more secured in SonarQube. Its a very good tool and its support multiple languages. Its main core competency is of static code analysis and that is why SonarQube exists and it does it exceedingly well. The quality of scan on code convention, best practices, coding standards, unit test coverage etc makes them one of the best competent tool in the market
VMAN has been used for reports provided to executive-level meetings. These reports showed our growth patterns, allowing for easier decisions on purchasing additional hardware.
VMAN has provided a positive impact on allowing for near real-time monitoring of resources, able to pinpoint when services are using more memory than expected, not running at all, or other options as defined.
VMAN was purchased to help monitor our VMware platform, the added abilities for AWS allowed us to migrate clients from on-prem to cloud-based with the same views.
Positive ROI from the standpoint of flagging several issues that would have otherwise likely been unaddressed and caused more time to be spent closer to launch
Slightly positive ROI from time-saving perspective (it's an automated check which is nice, but depending on the issues it finds, can take developers time to investigate and resolve)