
Spoom vs. Talend Open Studio (discontinued)
| Product | Rating | Most Used By | Product Summary | Starting Price |
|---|---|---|---|---|
 Spoom | Score8 out of 10 | Mid-Size Companies (51-1,000 employees) | Spoom (formerly Analyza) is a business intelligence solution that is provided by Spoom Software (formerly PIT Business). The vendor provides support services in Luxembourg, Belgium, France, and other parts of Europe. Spoom allows users to: Build several indicators and dashboards Build ad-hoc analysis without IT knowledge Navigate through data via drill-down and filtering Schedule reports and send results by mail or to external… | N/A |
 Talend Open Studio (discontinued) | Score9.7 out of 10 | N/A | Talend Open Studio was an open source integration software, used to build basic data pipelines or execute simple ETL and data integration tasks. Qlik and Talend discontinued the service in early 2024, and it is no longer available. | $0 per month |
| Spoom | Talend Open Studio (discontinued) | |||||||||||||||
|---|---|---|---|---|---|---|---|---|---|---|---|---|---|---|---|---|
| Editions & Modules |
| No answers on this topic | ||||||||||||||
| Offerings |
| |||||||||||||||
| Entry-level Setup Fee | $15,000 per installation (including licences and maintenance for 3 years) | No setup fee | ||||||||||||||
| Additional Details | The On-Premise or SaaS solutions are the same price; we provide a dedicated machine or virtual machine for both. For 10 users, the budget is from $15,000 to $90,000 for a full Business Intelligence solution (including licenses and maintenance for 3 years). The installation and configuration cost depends on customer's data architecture, volume and number of sources. It also depends on customizations required (i.e.: exporting pixel to pixel PDF files to a SharePoint platform). | — | ||||||||||||||
| More Pricing Information | ||||||||||||||||
| Spoom | Talend Open Studio (discontinued) | |||||||||||||||||||
|---|---|---|---|---|---|---|---|---|---|---|---|---|---|---|---|---|---|---|---|---|
| BI Standard Reporting |
| |||||||||||||||||||
| Ad-hoc Reporting |
| |||||||||||||||||||
| Report Output and Scheduling |
| |||||||||||||||||||
| Data Discovery and Visualization |
| |||||||||||||||||||
| Access Control and Security |
| |||||||||||||||||||
| Mobile Capabilities |
| |||||||||||||||||||
| Data Source Connection |
| |||||||||||||||||||
| Data Transformations |
| |||||||||||||||||||
| Data Modeling |
| |||||||||||||||||||
| Data Governance |
| |||||||||||||||||||
| Spoom | Talend Open Studio (discontinued) | |
|---|---|---|
| Small Businesses | No answers on this topic |  Skyvia Score10 out of 10 |
| Medium-sized Companies |  IBM Planning Analytics Score8.5 out of 10 |  IBM InfoSphere Information Server Score10 out of 10 |
| Enterprises |  Oracle Fusion Cloud Enterprise Performance Management Score7.2 out of 10 |  SolarWinds Task Factory Score8.3 out of 10 |
| All Alternatives | View all alternatives | View all alternatives |
| Spoom | Talend Open Studio (discontinued) | |
|---|---|---|
| Likelihood to Recommend | 8.2 | 7.9 |
| Likelihood to Renew | - | 10.0 |
| Usability | - | 3.0 |
| Performance | - | 4.0 |
| Support Rating | - | 4.9 |
| Data Sharing and Collaboration | 8.2 | - |
| Data Sources | 9.1 | - |
| Spoom | Talend Open Studio (discontinued) | |
|---|---|---|
| Likelihood to Recommend |
|
|
| Pros |
|
|
| Cons |
|
|
| Likelihood to Renew | No answers on this topic |
|
| Usability | No answers on this topic |
|
| Performance | No answers on this topic |
|
| Support Rating | No answers on this topic |
|
| Alternatives Considered |
|
|
| Return on Investment | No answers on this topic |
|
| ScreenShots | Spoom Screenshots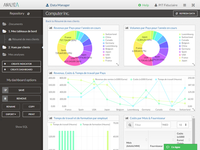 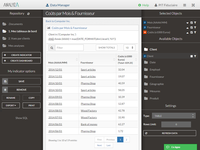  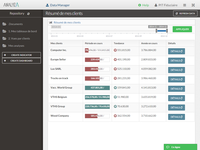   |


