TrustRadius: an HG Insights company

Clear Analytics

Score8.8 out of 10

19 Reviews and Ratings

What is Clear Analytics?

Clear Analytics is a business intelligence solution that enables non technical end users to perform analytics by leveraging existing knowledge of Excel coupled with a built in query builder. Some key features include: Dynamic Data Refresh, Data Share and In-Excel Collaboration. 


Media

Clear Analytics integrated Excel panel essentially transforms standalone Excel into an enterprise strength, fully auditable, collaborative and centralized business intelligence platform.
Users have the ability to dynamically query systems and render that data in any way they like.  No more waiting on IT to create reports.
Your firms existing knowledge of Excel enables the firm to be product from day 1. Use the skills already present in your organization and don't pay for outside reporting consultants to create reports for you.
Leverage the integration capability of Microsoft's Power BI to extend the reach of your data to web and mobile devices.
Leverage all of Excels capabilities, from it's slicers to miniature spark-line charts to create incredibly informative and responsive dashboards.

1 / 5

Top Performing Features

  • Multi-User Support (named login)

    Named model access means that users have access based on name and password.

    Category average: 8.3

  • Multiple Access Permission Levels (Create, Read, Delete)

    Multiple access permission levels means that different levels of users have different rights.

    Category average: 8.2

  • Drill-down analysis

    Drill down analysis is the ability to get to a further level of detail by going deeper into the hierarchy.

    Category average: 8.2

Areas for Improvement

  • Formatting capabilities

    Ability to format output e.g. conditional formatting, lines, headers, footers.

    Category average: 7.6

  • Dashboard / Report / Visualization Interactivity on Mobile

    In-app dashboard reports and data visualization.

    Category average: 7.4

  • Mobile Application

    A dedicated app for iOS and/or Android.

    Category average: 7.2

A good BI solution for small and mid size organizations.

Use Cases and Deployment Scope

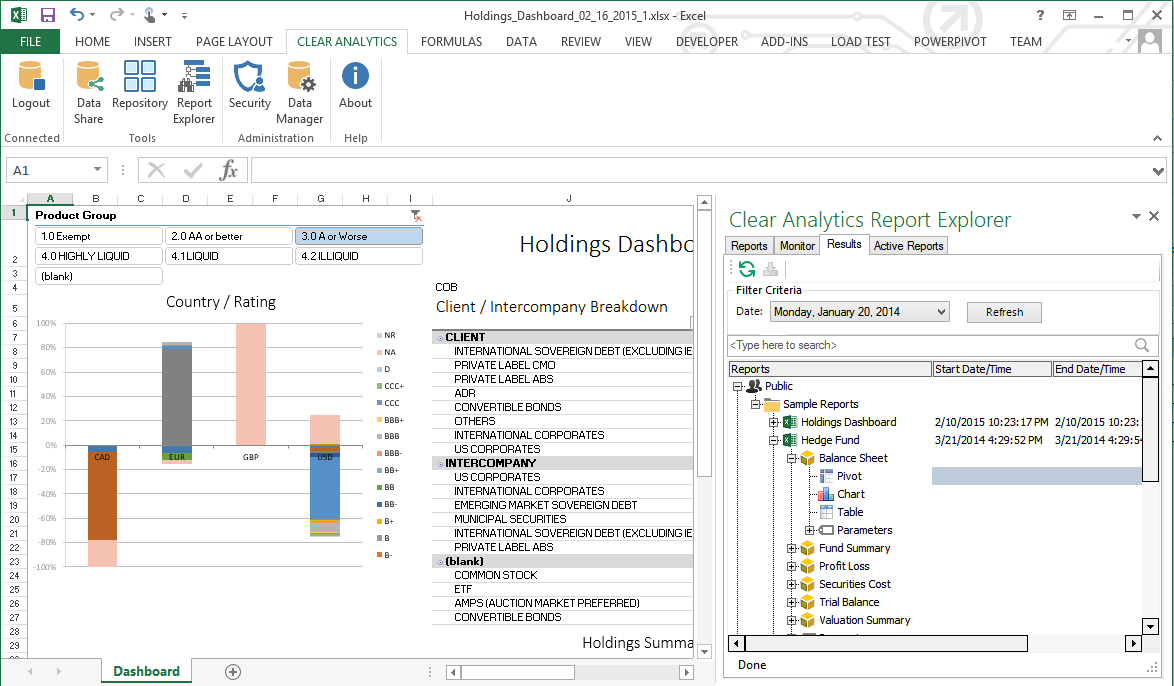
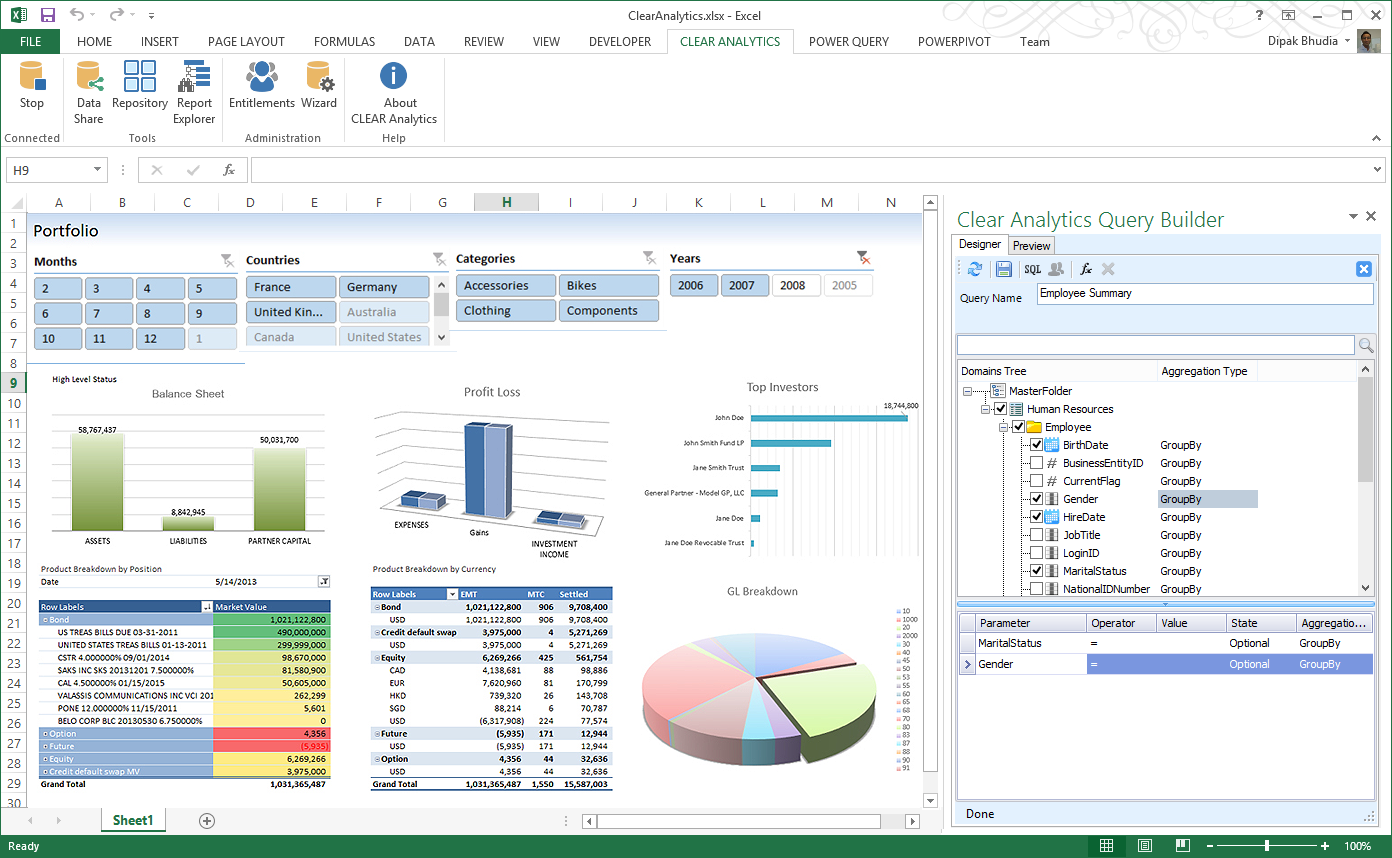
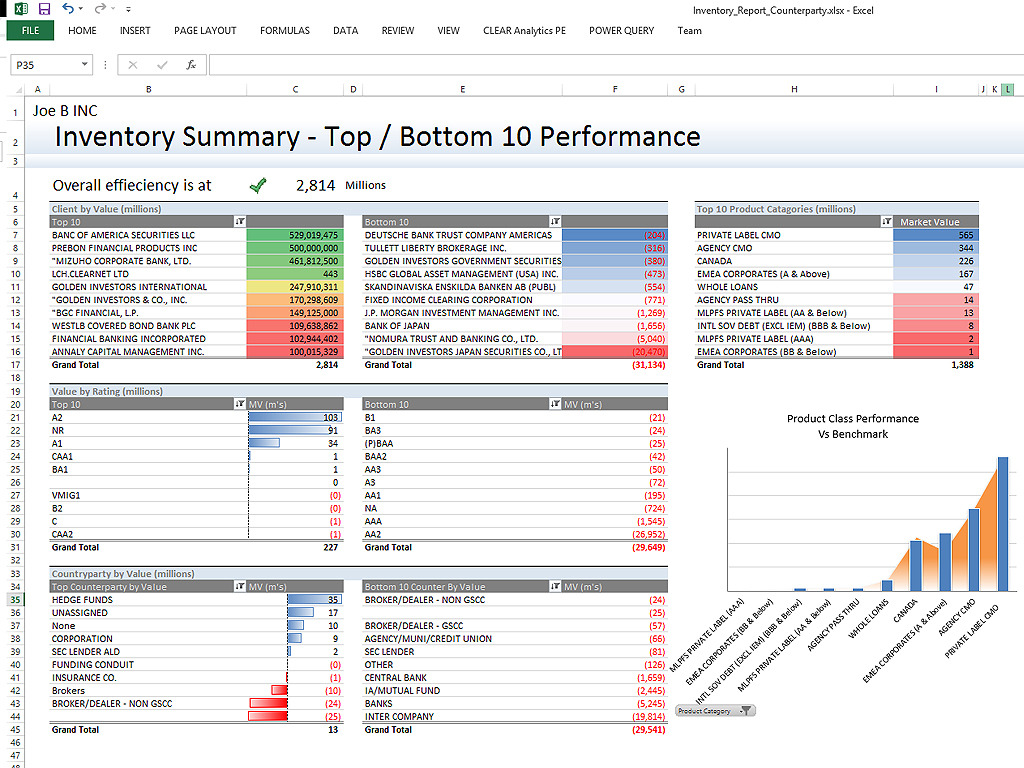
Clear Analytics is a business intelligence and data management platform built on the concept of self-service data governance. Unlike the other similar BI solutions, it offers extraction of data from a wide variety of sources whether the data is stored in the cloud or on physical premises. It has the ability to transform the data for meaningful data analysis which can be converted into powerful visualizations. It offers a subscription plan for various editions such as Small Business and Team plans in which you can opt for the fixed monthly and yearly rates according to the requirements. It also offers the API integration feature in which users can easily integrate any 3rd party applications and tools. We are working on a large data analytics program where we are integrating multiple data sources into our platform for data analytics.

Pros

  • Provides data security, governance, and compliance.
  • Flexibility to create ad-hoc reports.
  • Auto-refresh data can be set up for any frequency.
  • Integration with other 3rd party applications such as Power BI.
  • Great customer support and services.

Cons

  • Addition of OLAP (Online Analytical Processing) is highly required.
  • Require advance data analytics features such as predictive and descriptive analysis.
  • Addition of smart and advanced visualizations.
  • Reports must be shared without Power BI.
  • Pricing plan for Team edition subscription.

Return on Investment

  • The subscription plans are clear to understand (+ROI).
  • Customer support and services are good (+ROI).
  • User can't share reports without Power BI solution (-ROI).
  • No mobile app (Android and iOS) is available.

Alternatives Considered

Tableau Desktop, Microsoft Power BI, Sisense and Qlik Sense

Other Software Used

Qlik Sense, Microsoft Power BI, Sisense, Tableau Desktop

Usability

Amazing Data Analysis.

Use Cases and Deployment Scope

In our business, we use Clear Analytics to be able to get different reports on a variety of metrics and use this data to generate extensive and well-detailed analytics. We are able to use Excel in a different and more powerful way as Clear Analytics provides great tools to organize the data in Excel in a clearer way with no margin error because the automation directly extracts all the information from the spreadsheets or any other platform where the data is stored, as well as using it as an instrument to share data with different team members at the same time without there being issues on limited usage or editing, which is something essential for us because we have quite a few members working on data analysis which needs to work simultaneously!

Pros

  • Quick management of the data through Excel thanks to the tools Clear Analytics provides such as filtering different information for an easier view.
  • Ability to add new KPIs to measure different areas of our business.
  • Drag and drop tool which makes an easier usage of Excel.
  • Cost-effective. I find Clear Analytics to be affordable considering the number of features added and the unlimited sharing and editing it provides.

Cons

  • New employees have had a hard time understanding how to use Clear Analytics, which lacks beginner-friendly guides and it results in a more extensive training time for us.
  • It requires an extensive knowledge of Excel prior to using this software.

Return on Investment

  • Thanks to Clear Analytics, our team has been able to manage our data quickly and save us time manually entering every single piece of data that comes from another platform or even on Excel. I have been able to add new indicators in order to analyze different states of our sales and our improvement with our customers per region as well as being able to quickly generate and share reports with different team members. We saw results almost immediately and it has been a way to keep everything stored safely and at the same time be able to manage it easily without information getting lost or corrupted, which was our main fear.

Other Software Used

Microsoft Excel

Usability

Powerful data analysis platform with suitable dashboard

Use Cases and Deployment Scope

It has excel functionality that helps in data analysis. Clear Analytics has all data management tools that monitors behaviour across the entire enterprise. It gives us clear insights on what takes place within our business environment. It can transfer data and lublish it into our BI portal without any challenge. The excel functionalities features are easy to use and monitor the progress of data in our database.

Pros

  • Data visualization.
  • Publishing our datasets on our BI portal.
  • Data sharing across the company.

Cons

  • All the excel features function effectively.
  • I have no additional feature that I can recommend.

Return on Investment

  • Clear Analytics has created positive ROI.
  • It has highly contributed to achievement of our goals.

Usability

Powerful Reporting and Dashboard tool built for Microsoft Excel and others

Use Cases and Deployment Scope

As a company, we were heavily reliant on Excel and Google Sheets to store our data. We were using Charts and Analytics within Google Sheets and Excel for our reporting needs, but we've been in multiple situations where it was becoming overwhelming, but switching out of Excel was difficult for us. When we used Clear Analytics, it could allow us to run Custom Dashboards on top of our existing data sources without having to spend time and effort on migrating our data.

It's also very developer-friendly and supports integration with other development environments.

Pros

  • Integrates seamlessly with Microsoft Excel
  • Build powerful and intuitive dashboards for reporting
  • Integrates with Microsoft BI Reporting

Cons

  • Mobile app access would be great
  • Feature to schedule reports would be amazing
  • More advanced Visual Dashboards would be better

Return on Investment

  • Super useful to get started immediately
  • Didn't have to rely on migrating data
  • Easy to add members
  • Easy to learn and build charts

Alternatives Considered

Amplitude Analytics

Other Software Used

Amplitude Analytics, WordPress, Yoast Wordpress SEO Plugins

Usability

Great analytics tool

Use Cases and Deployment Scope

We use clear analytics to keep track of all of our analytics information. It has helped us gather and analyze our data in one location easily.

Pros

  • Excellent customer support, they are very helpful
  • The interface is pretty easy to use
  • Graphing is great for data visualization

Cons

  • They do not integrate with a lot of other software out there
  • Other than this i do not have a lot of complaints

Return on Investment

  • Has helped us analyze data to make decisions that have allowed us to increase revenue
  • Saved time that we were able to work on other things

Usability