


Value for money tool

Use Cases and Deployment Scope
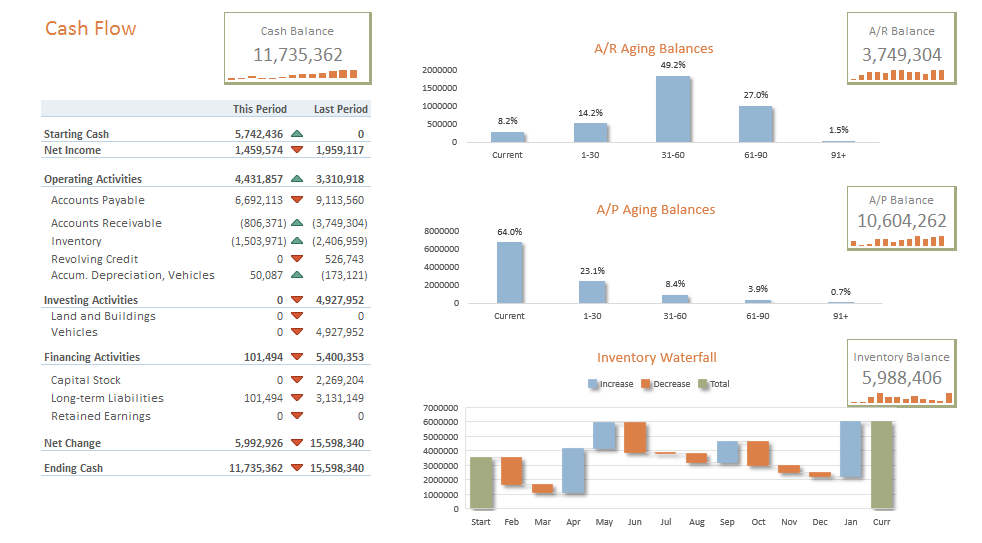
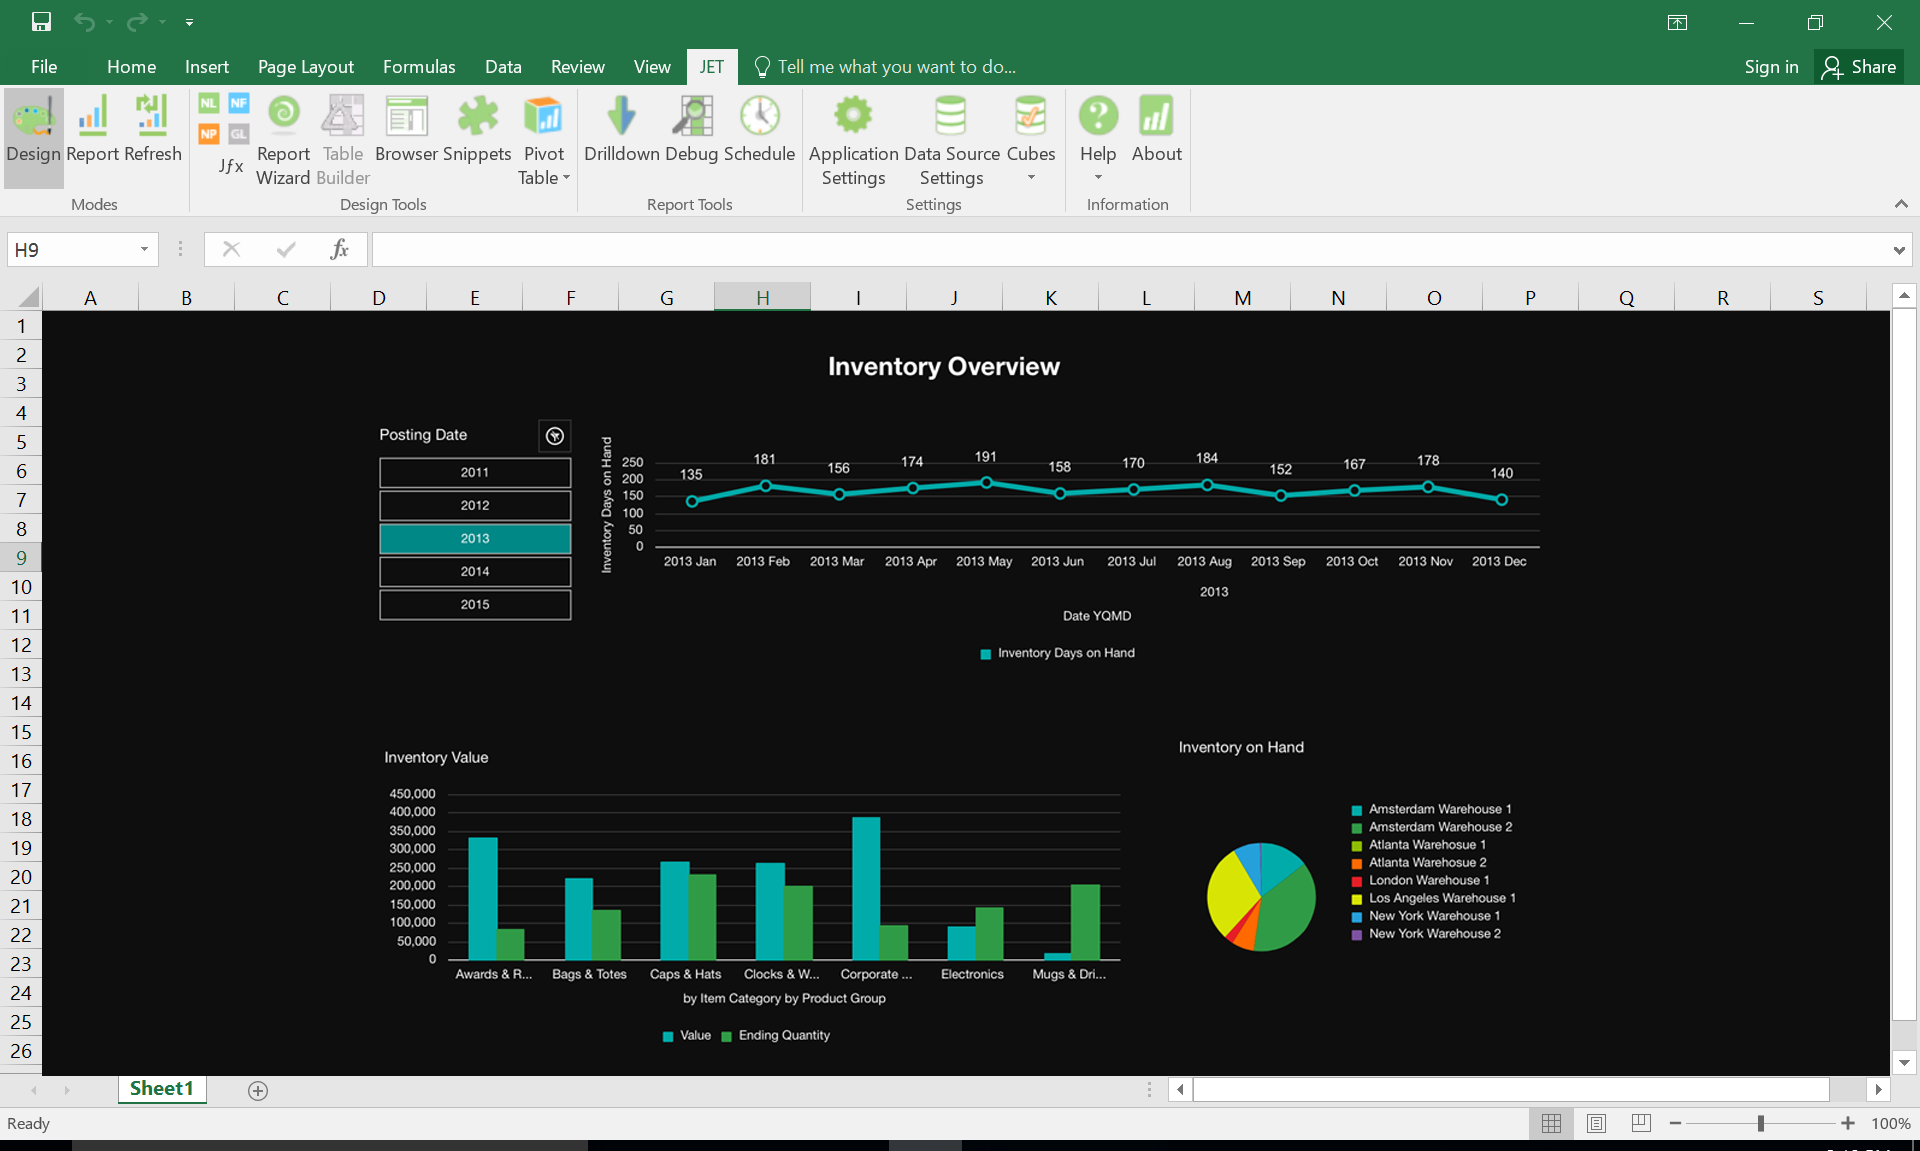
We have a multiple data sources that we work with. To make a combined report to make further buying decisions for our clients ts we have used Jet Reports tool. Its easy to use, drag and drop reports makes it easier for those without data analytics background to create reports
Pros
- Integrated reporting
- Customizable reports
- Easy to use
Cons
- Integration with social media channels
- Calculated fields
- Better graphics or color combinations for reports
Return on Investment
- Prediction analysis has helped the business to make future plans
- Report scheduling has eliminated a lot of manual work
Alternatives Considered
Tableau Public
Other Software Used
Microsoft Power BI, Tableau Desktop