TrustRadius: an HG Insights company

What is MonitUp?

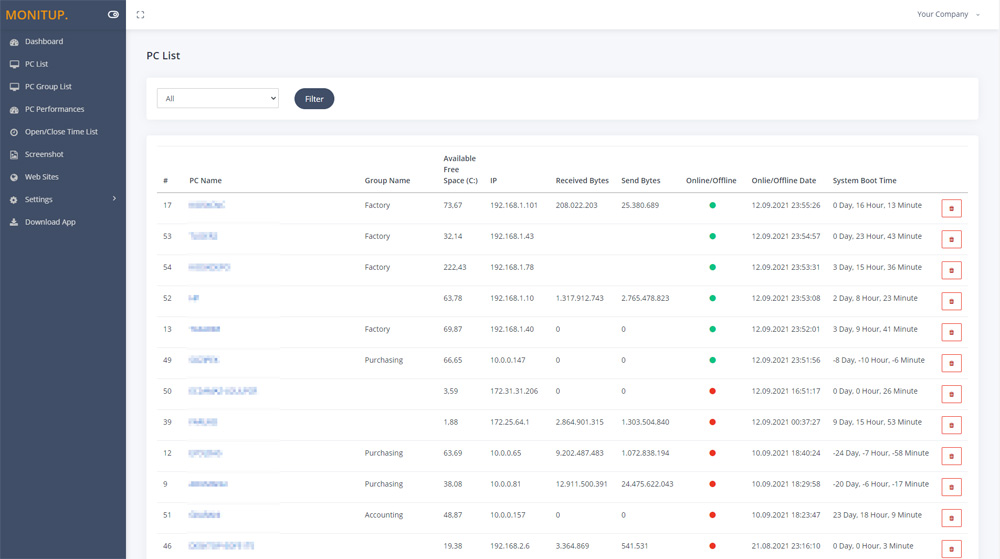
Employee monitoring platform designed to help businesses with monitoring employee website access, computer performance, and time tracking. Features of the platform include an activity dashboard with an overview of all employees' activity, login and logout tracking, visibility into which websites employees are accessing, a list of all online and offline computers, customization, and user-specific data.

Categories & Use Cases

Media

Screenshot of User Dashboard
It gives you information about users, when he turned on his computer, how long he was away from his computer, when he shut down his computer in the evening. You can see the pie chart of the most used applications. The list at the bottom will show you the details of all the transactions of the user in the date range you have specified. In this way, you can have an idea about the efficiency of the user.
Screenshot of Dashboard
You can see the summary of the movements of the company employees on this screen. Online Computers, Offline Computers, IP Addresses, latest trading hours and pie chart of the most used programs in your company.
Screenshot of Employee entrance and exit control
You can see when all employees turned on and off their computers. It helps you to distinguish missing or overwork easily.
Screenshot of Websites are under control
You can see which websites employees browse and keep them under control. It is important information to increase employee productivity.
Screenshot of Screenshot
Screenshots of the users you specify are taken every 5 minutes. In this way, you will have more data at hand to increase efficiency.
Screenshot of Application Categories
All applications are divided into 3 categories. You can set the desired application as Productive, Unproductive Neutral. Thus, you can see the transactions on the graph and instantly analyze the efficiency of the user.
Screenshot of Computer List
You can see the online or offline status of the computers in your company, Group Name, Available Free Space (C:), IP address, Received Bytes, Sent Bytes, Online/Offline, last transaction time, System Boot Time.

1 / 7

Screenshot of User Dashboard It gives you information about users, when he turned on his computer, how long he was away from his computer, when he shut down his computer in the evening. You can see the pie chart of the most used applications. The list at the bottom will show you the details of all the transactions of the user in the date range you have specified. In this way, you can have an idea about the efficiency of the user.