Quantitative Versus Qualitative Data
For different research questions, different types of data will be useful. Quantitative and qualitative data are the two broad categories your information will fall into. Understanding the differences helps you understand the uses of each. This article will help you get the most out of your research and generate more insightful results. We will discuss the characteristics of each data type, what they are best for, and how to analyze them.
Quick Reference Table
| Quantitative Data | Qualitative Data | |
| Catagory | Quantity | Traits |
| Examples of Data | Mass, Number of Objects, Width in Feet/Meters | Color, Texture, “Larger than X,” Experiences |
| How to Gather | Measurement, Counting, Surveys | Observation, Explanation, Surveys |
| Analysis Methods | Cross Tabulation, Trend Analysis,Data Visualization | Content Analysis, Narrative Analysis, Ethnography, Quotes, Natural Language Processing |
| Best For: | Statistical Analysis, Comparison to a Control group | Descriptions, Experiences, Human Behavior and Emotions |
Quantitative Versus Qualitative Examples
With the quick-reference chart in mind, understanding the difference between these two is easy. Quantitative data deals with numbers and directly measurable, standardized information. Qualitative data is focused on the characteristics of something.
A great way to remember these things is to look at the words themselves. Quantitative deals with quantity. Qualitative refers to qualities. The key is in the term. To further understand these types of data, we will be using a simple example. We will set up a series of mini-experiments, and show how and when you would use each.
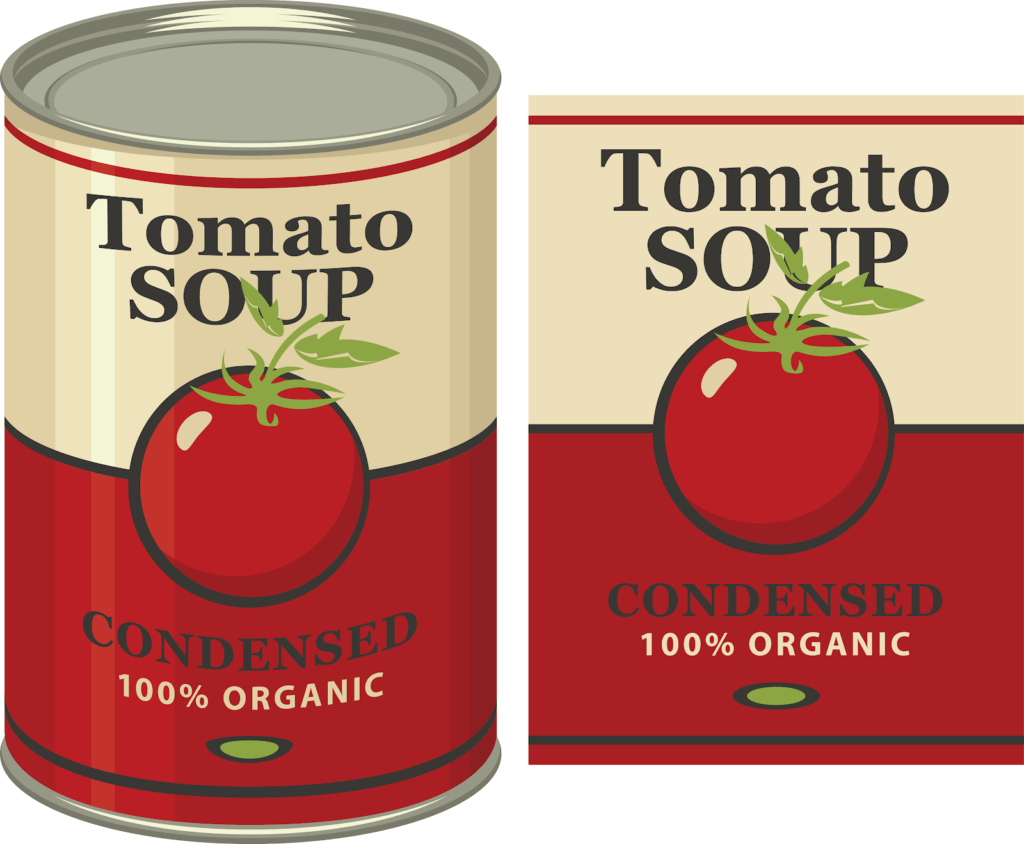
Consider this humble can of stock-image tomato soup. You are a product researcher, about to launch a new brand to take the lunch industry by storm. You plan to give it to 100 participants and collect information for your research project.
Qualitative data about the soup refers to how it could be characterized. The soup is red and too salty. The cans feel heavy. Descriptions they wrote of the taste and color are your qualitative data. For example, maybe they say it wasn’t as good as a name brand.
Quantitative data is numerical data. A measure of calories is quantitative. The number of people who said it was good, or bad—that’s quantitative data. The mass of the 100 cans you measured beforehand to get a box strong enough to support all of them without breaking is another example.
| Quantitative Data Examples in the Soup Experiment | Qualitative Data Examples in the Soup Experiment |
| 100 Cans of Soup, 1 Per Person | Participants Reported Feeling Full |
| 78 People Liked the Soup | A Taster Said the Soup Was “My Favorite Ever” |
| 21 People Felt it was Too Salty | Taster Saying it Was “Saltier Than the Ocean” |
| 36 People Said they Would Buy this Over a Competitor | One Person Said it Made Them Want a Grilled Cheese |
| The Average Rating out of 10 was a 6.6 | People Were Observed Using Bread to Get the Last Bit of Soup |
A common misunderstanding is that all things regarding people’s experiences are qualitative. If you count the number of people who felt it was served too hot, this is quantitative data. While the number describes an experience, it is the number we are using to quantify their feelings about the temperature. Inversely, if we asked them to describe it, the description of “too hot” and “it burned my mouth” are qualities they experienced.
How do I Gather and Use Quantitative Data?
Quantitative research generally has a higher experimental value. This type of research can be more easily compared to a control group. It can also have statistical significance, a measure of data validity. This type has high reliability. Quantitative information works well for methodologies that require statistics-based information.
In our research, we have used both. Every year, we publish an annual report on Women in Tech. This focuses on the state of gender equality in our industry. This research gathers both qualitative and quantitative data.
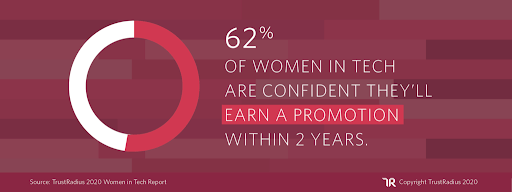
Here is a perfect example of quantitative data. This number reflects a percentage of respondents who chose a certain option in the survey we made.
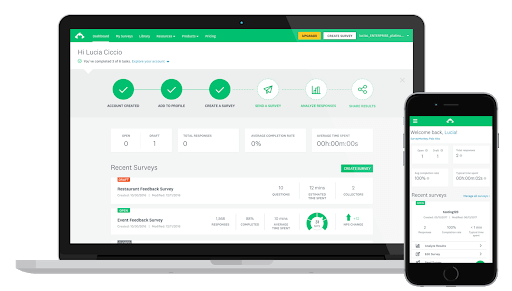
Surveys are a fantastic way to get measurable information from large groups of people. You can ask people to rank products or evaluate them on a numerical scale. This can also take the form of selecting which option best describes the person’s feelings. For quantitative data, researchers tend to ask for either a response in the form of a number or give a number of options to choose from. Tools like SurveyMonkey are commonplace.
There are many other methods of collecting this type of info.
Physical measurement tools like scales and rulers are classics. You can also take advantage of existing information.
A document review of sales records is Quantitative. This could be done to find out existing market trends.
A/B testing is a common method of directly comparing two products or ideas in a quantitative manner. In this method, one controlled variable is evaluated with different versions of similar subjects. This results in measurable insights that are comparable to control. A/B testing is a great way of testing a hypothesis. You would use this to evaluate which version of a product performs better in an empirical, objective way. For example, does the green button or the blue button get more clicks?
In doing quantitative analysis, the key is statistical significance. The sample size will usually be large. Researchers use sampling methods to avoid biases. Here is a calculator you can use to determine how many people you would need to sample to get accurate results. This informs how many participants you would need to make your data statistically useful.
If you want to learn much more about how quantitative data is used and gathered, this piece goes into far greater detail.
How and When Will I Use Qualitative Data?
Qualitative research is great for insights into how a product feels to use and how people interact with it. This will provide more detailed information, and is better for human interactions. For our soup example, product research may use the information to tweak the recipe to improve taste or color. This can involve in-depth interviews and other qualitative research methods. This research method allows for more insight from fewer people.
For our Women in Tech survey, the qualitative data came in the form of respondents’ feelings on major issues. Here, we see descriptions of behavior and personal experiences.

The major benefit of qualitative information is the detail and human-nature insight it can provide. In Qualitative research, surveys usually include more open-ended questionnaires.
Usability testing is a classic way to gain insight into the experience of a user. In this, participants are asked to try and use a product. They are often observed and then questioned about how they felt it went. For user experience and interface designers, this feedback can be vital. Follow-up questions can allow for much greater detail of information. They also allow for branching question sets.
Focus groups are another common qualitative approach. In this, a small but representative sample of participants is asked for their ideas and feedback on a product or concept. These are a staple of market researchers and advertising professionals.
If your motivation is to explore characteristics and generalizations, this will work well for you. Qualitative data is perfect for human emotion and experiences. It measures in more natural settings and can offer non-numerical data. It can also help you uncover “unknown unknowns.” Through qualitative analysis, researchers often learn which variables they should test. From here, they can measure their area of study in a quantitative method. This allows for more numerical, testable information.
I Want to Learn More
Qualitative and quantitative datasets are powerful information that can inform any research project. These methods do not exist in a vacuum. Using them in tandem can make use of the benefits of each. If you are still confused, consider watching this video that goes into detail explaining the differences.
Was this helpful?