Amazon CloudWatch vs. ManageEngine ADAudit Plus
Amazon CloudWatch vs. ManageEngine ADAudit Plus
| Product | Rating | Most Used By | Product Summary | Starting Price |
|---|---|---|---|---|
 Amazon CloudWatch | N/A | Amazon CloudWatch is a native AWS monitoring tool for AWS programs. It provides data collection and resource monitoring capabilities. | $0 per canary run | |
 ManageEngine ADAudit Plus | N/A | ADAudit Plus offers real-time monitoring, user and entity behaviour analytics, and change audit reports that helps users keep AD and IT infrastructure secure and compliant. Track all changes to Windows AD objects including users, groups, computers, GPOs, and OUs. Achieve hybrid AD monitoring with a single, correlated view of all the activities happening across both on-premises AD and Azure AD. Monitor every user's logon and logoff activity, including… | $595 per year |
| Amazon CloudWatch | ManageEngine ADAudit Plus | |||||||||||||||
|---|---|---|---|---|---|---|---|---|---|---|---|---|---|---|---|---|
| Editions & Modules |
|
| ||||||||||||||
| Offerings |
| |||||||||||||||
| Entry-level Setup Fee | No setup fee | No setup fee | ||||||||||||||
| Additional Details | With Amazon CloudWatch, there is no up-front commitment or minimum fee; you simply pay for what you use. You will be charged at the end of the month for your usage. | Pricing is dependent on the number of domain controllers and starts at $595/year for the Standard edition, and $945/year for the Professional edition. | ||||||||||||||
| More Pricing Information | ||||||||||||||||
| Amazon CloudWatch | ManageEngine ADAudit Plus |
|---|
| Amazon CloudWatch | ManageEngine ADAudit Plus | ||||||||||||||||||
|---|---|---|---|---|---|---|---|---|---|---|---|---|---|---|---|---|---|---|---|
| Monitoring Tasks |
| ||||||||||||||||||
| Management Tasks |
| ||||||||||||||||||
| Reporting |
| ||||||||||||||||||
| Security |
|
| Amazon CloudWatch | ManageEngine ADAudit Plus | |
|---|---|---|
| Small Businesses |  InfluxDB Score 8.8 out of 10 |  Panda Systems Management Score 7.6 out of 10 |
| Medium-sized Companies |  Sumo Logic Score 8.8 out of 10 |  ManageEngine Site24x7 Score 9.5 out of 10 |
| Enterprises |  NetBrain Technologies Score 8.9 out of 10 | ManageEngine Site24x7 Score 9.5 out of 10 |
| All Alternatives | View all alternatives | View all alternatives |
| Amazon CloudWatch | ManageEngine ADAudit Plus | |
|---|---|---|
| Likelihood to Recommend | 7.7 (40 ratings) | 9.5 (51 ratings) |
| Likelihood to Renew | - (0 ratings) | 9.0 (4 ratings) |
| Usability | 7.0 (3 ratings) | 8.2 (2 ratings) |
| Availability | - (0 ratings) | 8.2 (1 ratings) |
| Performance | - (0 ratings) | 7.3 (1 ratings) |
| Support Rating | 8.4 (8 ratings) | 8.0 (44 ratings) |
| Online Training | - (0 ratings) | 7.3 (1 ratings) |
| Implementation Rating | - (0 ratings) | 7.7 (2 ratings) |
| Configurability | - (0 ratings) | 6.4 (1 ratings) |
| Product Scalability | - (0 ratings) | 8.2 (1 ratings) |
| Vendor post-sale | - (0 ratings) | 8.2 (1 ratings) |
| Vendor pre-sale | - (0 ratings) | 7.3 (1 ratings) |
| Amazon CloudWatch | ManageEngine ADAudit Plus | |
|---|---|---|
| Likelihood to Recommend | Amazon AWS
| ManageEngine, A Div of Zoho Corporation Pvt Ltd
 Ken Lubar CTO |
| Pros | Amazon AWS
 Apurv Doshi Senior Solutions Architect | ManageEngine, A Div of Zoho Corporation Pvt Ltd
 Zwier Dijkhuis Systems Engineer |
| Cons | Amazon AWS
| ManageEngine, A Div of Zoho Corporation Pvt Ltd
|
| Likelihood to Renew | Amazon AWS No answers on this topic | ManageEngine, A Div of Zoho Corporation Pvt Ltd
|
| Usability | Amazon AWS
| ManageEngine, A Div of Zoho Corporation Pvt Ltd
|
| Reliability and Availability | Amazon AWS No answers on this topic | ManageEngine, A Div of Zoho Corporation Pvt Ltd
 Michael Baxley Information Technology Director |
| Performance | Amazon AWS No answers on this topic | ManageEngine, A Div of Zoho Corporation Pvt Ltd
Michael Baxley Information Technology Director |
| Support Rating | Amazon AWS
 Ramindu Deshapriya Lead Consultant - Technology | ManageEngine, A Div of Zoho Corporation Pvt Ltd
|
| Online Training | Amazon AWS No answers on this topic | ManageEngine, A Div of Zoho Corporation Pvt Ltd
Michael Baxley Information Technology Director |
| Implementation Rating | Amazon AWS No answers on this topic | ManageEngine, A Div of Zoho Corporation Pvt Ltd
|
| Alternatives Considered | Amazon AWS
| ManageEngine, A Div of Zoho Corporation Pvt Ltd
|
| Scalability | Amazon AWS No answers on this topic | ManageEngine, A Div of Zoho Corporation Pvt Ltd
Michael Baxley Information Technology Director |
| Return on Investment | Amazon AWS
 Rob Domenico Senior Systems Administrator | ManageEngine, A Div of Zoho Corporation Pvt Ltd
|
| ScreenShots | Amazon CloudWatch Screenshots     | ManageEngine ADAudit Plus Screenshots   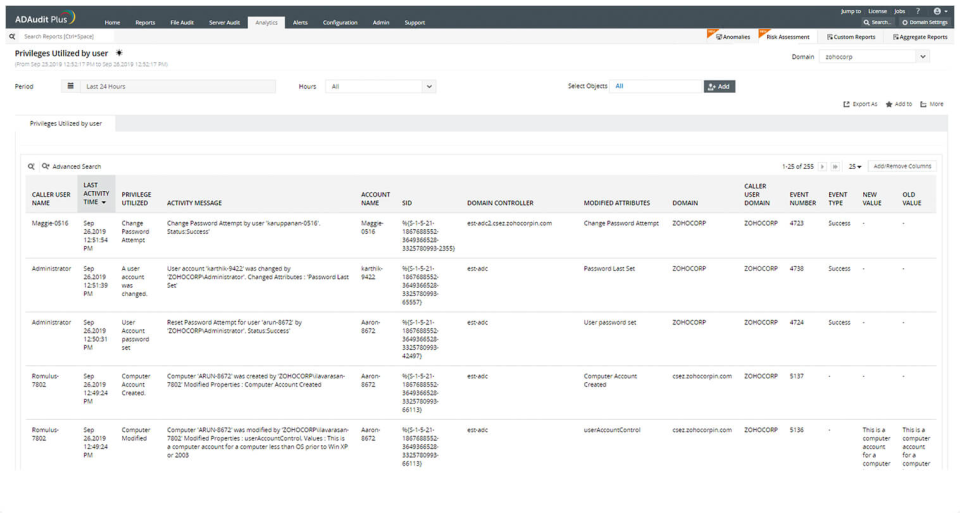  |