Amazon RDS Performance Insights vs. SolarWinds Database Performance Monitor
Amazon RDS Performance Insights vs. SolarWinds Database Performance Monitor
| Product | Rating | Most Used By | Product Summary | Starting Price |
|---|---|---|---|---|
 Amazon RDS Performance Insights | N/A | Amazon RDS Performance Insights is a database performance tuning and monitoring feature that helps to asess the load on a database, and determine when and where to take action. Performance Insights helps non-experts to detect performance problems with a dashboard that visualizes database load. Performance Insights uses lightweight data collection methods that don’t impact the performance of your applications, and makes it easy to see which SQL statements are causing… | $0.01 per 1,000 requests. | |
 SolarWinds Database Performance Monitor | N/A | VividCortex, acquired by SolarWinds in December 2019, provides database performance monitoring designed to increase system performance, team efficiency, and infrastructure cost savings. The GDPR- and SOC 2-compliant platform offers visibility into major open-source databases—MySQL, PostgreSQL, Amazon Aurora, MongoDB, and Redis—for the engineering team at scale. Industry leaders like Etsy, GitHub, SendGrid, and Yelp rely on Database Performance Monitor for all-query monitoring and drill… | N/A |
| Amazon RDS Performance Insights | SolarWinds Database Performance Monitor | |||||||||||||||
|---|---|---|---|---|---|---|---|---|---|---|---|---|---|---|---|---|
| Editions & Modules | No answers on this topic | No answers on this topic | ||||||||||||||
| Offerings |
| |||||||||||||||
| Entry-level Setup Fee | No setup fee | No setup fee | ||||||||||||||
| Additional Details | — | — | ||||||||||||||
| More Pricing Information | ||||||||||||||||
| Amazon RDS Performance Insights | SolarWinds Database Performance Monitor |
|---|
| Amazon RDS Performance Insights | SolarWinds Database Performance Monitor | |
|---|---|---|
| Likelihood to Recommend | 10.0 (1 ratings) | 8.0 (1 ratings) |
| Amazon RDS Performance Insights | SolarWinds Database Performance Monitor | |
|---|---|---|
| Likelihood to Recommend | Amazon AWS
| SolarWinds
 Mike Maner Network Systems Engineer |
| Pros | Amazon AWS
| SolarWinds
Mike Maner Network Systems Engineer |
| Cons | Amazon AWS
| SolarWinds
Mike Maner Network Systems Engineer |
| Alternatives Considered | Amazon AWS
| SolarWinds
Mike Maner Network Systems Engineer |
| Return on Investment | Amazon AWS
| SolarWinds
Mike Maner Network Systems Engineer |
| ScreenShots | SolarWinds Database Performance Monitor Screenshots  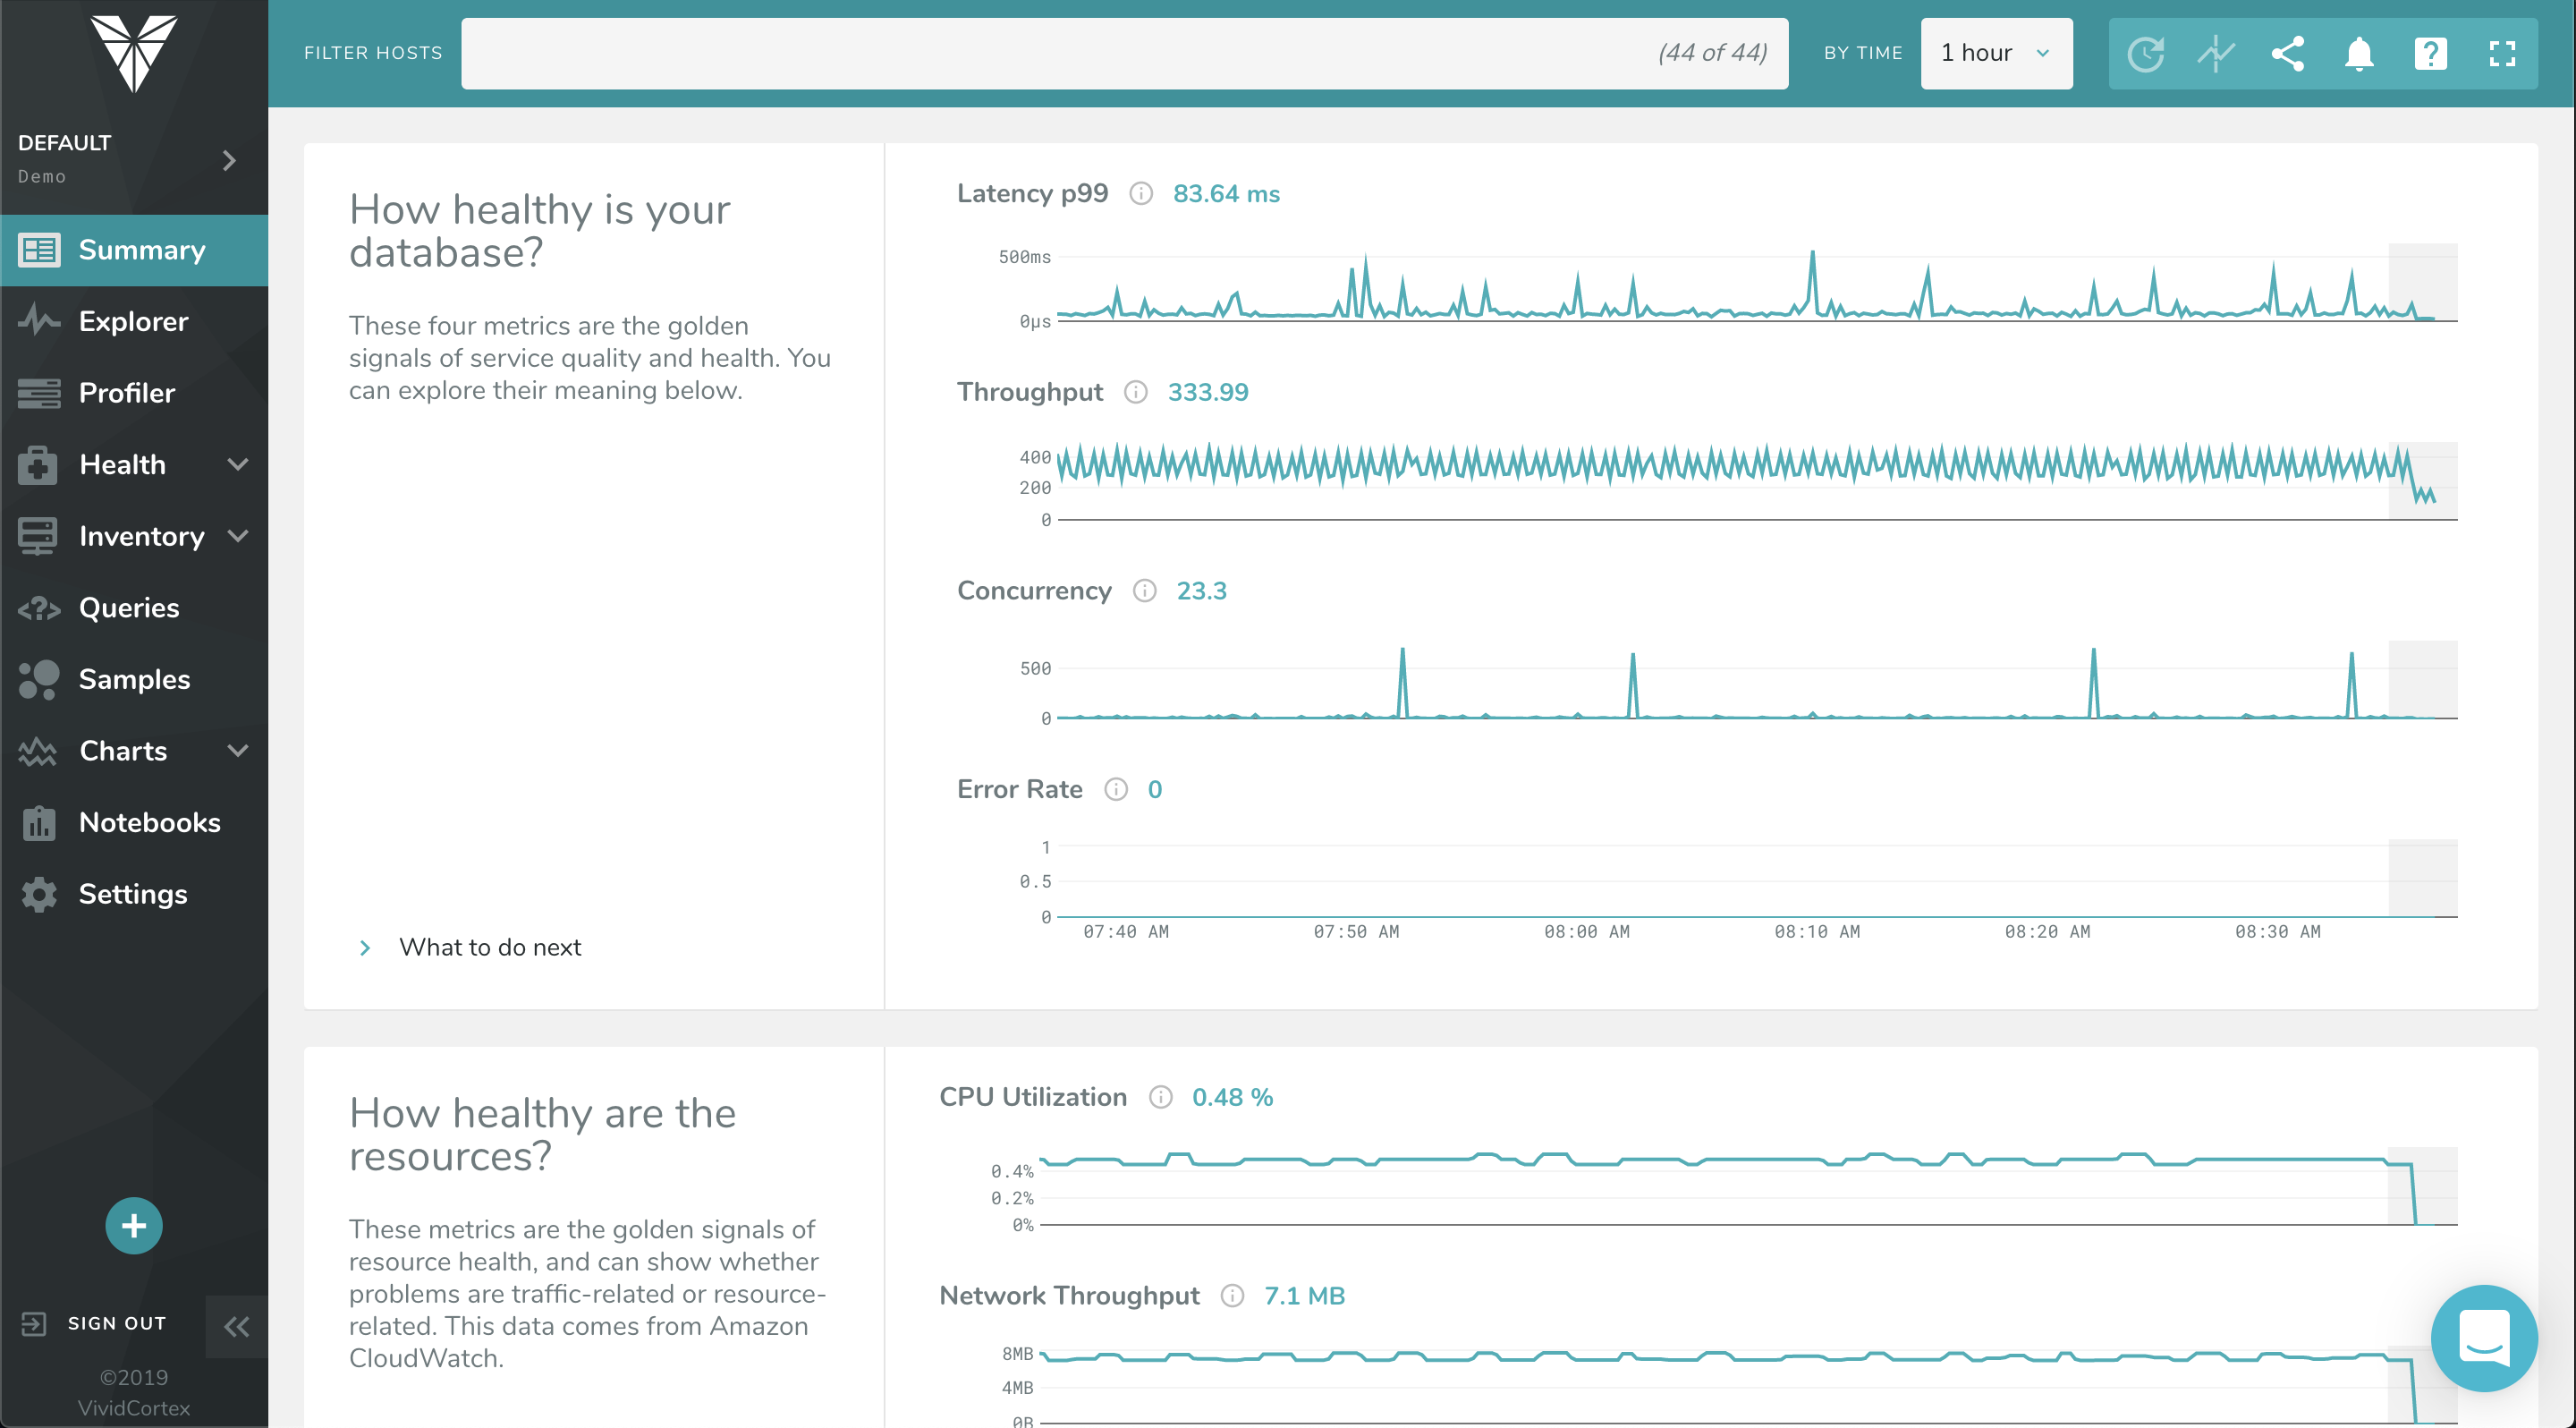  |