Anaconda vs. Lightning Tools Data Viewer

Overview
ProductRatingMost Used ByProduct SummaryStarting Price
Anaconda
Score 8.3 out of 10
N/A
Anaconda provides access to the foundational open-source Python and R packages used in modern AI, data science, and machine learning. These enterprise-grade solutions enable corporate, research, and academic institutions around the world to harness open-source for competitive advantage and research. Anaconda also provides enterprise-grade security to open-source software through the Premium Repository.
$0
per month
Lightning Tools Data Viewer
Score 9.1 out of 10
Mid-Size Companies (51-1,000 employees)
The Data Viewer provides data visualization in the form of reports or charts that can be created and customized to suit a business's needs. Silos of data exist in most organizations and yet contain valuable insights into how well the organization is performing and where action is needed. Those silos often include Microsoft Excel workbooks, Microsoft SQL Azure databases, On-Premises data sources accessible through OData or Business Connectivity Services and even SharePoint Lists. These data…
$1,250
per year per installation
Pricing
AnacondaLightning Tools Data Viewer
Editions & Modules
Free Tier
$0
per month
Starter Tier
$9
per month
Business Tier
$50
per month per user
Enterprise Tier
60.00+
per month per user
Data Viewer OnPrem
$1,000
per year Per installation, 1 x WFE
Data Viewer Online
$1,250
per year per installation
Data Viewer OnPrem Enterprise Edition
POA
per year Per installation, 4+ WFE
Data Viewer Online Enterprise Edition
POA
per year per installation
Offerings
Pricing Offerings
AnacondaLightning Tools Data Viewer
Free Trial
NoYes
Free/Freemium Version
YesNo
Premium Consulting/Integration Services
YesNo
Entry-level Setup FeeNo setup feeNo setup fee
Additional Details—Prices stated are minimum per installation for "stock" products. Enterprise editions can be amended to suit business needs if deemed necessary, additional costs incurred and TBD. All packages include free technical support. Free upgrades available to latest versions of tool as they are released. (online version)
More Pricing Information
Community Pulse
AnacondaLightning Tools Data Viewer
Top Pros

No answers on this topic

Top Cons

No answers on this topic

Features
AnacondaLightning Tools Data Viewer
Platform Connectivity
Comparison of Platform Connectivity features of Product A and Product B
Anaconda
9.3
25 Ratings
11% above category average
Lightning Tools Data Viewer
-
Ratings
Connect to Multiple Data Sources9.822 Ratings00 Ratings
Extend Existing Data Sources8.024 Ratings00 Ratings
Automatic Data Format Detection9.721 Ratings00 Ratings
MDM Integration9.614 Ratings00 Ratings
Data Exploration
Comparison of Data Exploration features of Product A and Product B
Anaconda
8.5
25 Ratings
2% above category average
Lightning Tools Data Viewer
-
Ratings
Visualization9.025 Ratings00 Ratings
Interactive Data Analysis8.024 Ratings00 Ratings
Data Preparation
Comparison of Data Preparation features of Product A and Product B
Anaconda
9.0
26 Ratings
10% above category average
Lightning Tools Data Viewer
-
Ratings
Interactive Data Cleaning and Enrichment8.823 Ratings00 Ratings
Data Transformations8.026 Ratings00 Ratings
Data Encryption9.719 Ratings00 Ratings
Built-in Processors9.620 Ratings00 Ratings
Platform Data Modeling
Comparison of Platform Data Modeling features of Product A and Product B
Anaconda
9.2
24 Ratings
9% above category average
Lightning Tools Data Viewer
-
Ratings
Multiple Model Development Languages and Tools9.023 Ratings00 Ratings
Automated Machine Learning8.921 Ratings00 Ratings
Single platform for multiple model development10.024 Ratings00 Ratings
Self-Service Model Delivery9.019 Ratings00 Ratings
Model Deployment
Comparison of Model Deployment features of Product A and Product B
Anaconda
9.5
21 Ratings
11% above category average
Lightning Tools Data Viewer
-
Ratings
Flexible Model Publishing Options10.021 Ratings00 Ratings
Security, Governance, and Cost Controls9.020 Ratings00 Ratings
BI Standard Reporting
Comparison of BI Standard Reporting features of Product A and Product B
Anaconda
-
Ratings
Lightning Tools Data Viewer
9.1
1 Ratings
8% above category average
Customizable dashboards00 Ratings9.11 Ratings
Report Formatting Templates00 Ratings9.11 Ratings
Ad-hoc Reporting
Comparison of Ad-hoc Reporting features of Product A and Product B
Anaconda
-
Ratings
Lightning Tools Data Viewer
8.2
1 Ratings
3% above category average
Drill-down analysis00 Ratings6.41 Ratings
Formatting capabilities00 Ratings9.11 Ratings
Report sharing and collaboration00 Ratings9.11 Ratings
Data Discovery and Visualization
Comparison of Data Discovery and Visualization features of Product A and Product B
Anaconda
-
Ratings
Lightning Tools Data Viewer
3.6
1 Ratings
77% below category average
Pre-built visualization formats (heatmaps, scatter plots etc.)00 Ratings3.61 Ratings
Best Alternatives
AnacondaLightning Tools Data Viewer
Small Businesses
Jupyter Notebook
Jupyter Notebook
Score 9.2 out of 10
Supermetrics
Supermetrics
Score 9.4 out of 10
Medium-sized Companies
Posit
Posit
Score 9.8 out of 10
Mathematica
Mathematica
Score 8.2 out of 10
Enterprises
Posit
Posit
Score 9.8 out of 10
Sigma
Sigma
Score 9.2 out of 10
All AlternativesView all alternativesView all alternatives
User Ratings
AnacondaLightning Tools Data Viewer
Likelihood to Recommend
10.0
(38 ratings)
9.1
(1 ratings)
Likelihood to Renew
7.0
(1 ratings)
-
(0 ratings)
Usability
9.0
(3 ratings)
-
(0 ratings)
Support Rating
8.9
(9 ratings)
-
(0 ratings)
User Testimonials
AnacondaLightning Tools Data Viewer
Likelihood to Recommend
Anaconda
I have asked all my juniors to work with Anaconda and Pycharm only, as this is the best combination for now. Coming to use cases: 1. When you have multiple applications using multiple Python variants, it is a really good tool instead of Venv (I never like it). 2. If you have to work on multiple tools and you are someone who needs to work on data analytics, development, and machine learning, this is good. 3. If you have to work with both R and Python, then also this is a good tool, and it provides support for both.
Read full review
Lightning Tools
Lightning Tools Data Viewer is well suited for re-surfacing data and customizing its look and feel.
Read full review
Pros
Anaconda
  • Anaconda is a one-stop destination for important data science and programming tools such as Jupyter, Spider, R etc.
  • Anaconda command prompt gave flexibility to use and install multiple libraries in Python easily.
  • Jupyter Notebook, a famous Anaconda product is still one of the best and easy to use product for students like me out there who want to practice coding without spending too much money.
Read full review
Lightning Tools
  • Shows Lists created on different sites to be seen and controlled on another site in a Tenant
  • Allows selection of layouts and coloring way beyond what other programs do.
  • Easy to learn and very functional.
Read full review
Cons
Anaconda
  • It can have a cloud interface to store the work.
  • Compatible for large size files.
  • I used R Studio for building Machine Learning models, Many times when I tried to run the entire code together the software would crash. It would lead to loss of data and changes I made.
Read full review
Lightning Tools
  • Data Viewer has a graph feature that is old school flat design. We loved the In House real 3D graph Lightning Tools program.
Read full review
Likelihood to Renew
Anaconda
It's really good at data processing, but needs to grow more in publishing in a way that a non-programmer can interact with. It also introduces confusion for programmers that are familiar with normal Python processes which are slightly different in Anaconda such as virtualenvs.
Read full review
Lightning Tools
No answers on this topic
Usability
Anaconda
I am giving this rating because I have been using this tool since 2017, and I was in college at that time. Initially, I hesitated to use it as I was not very aware of the workings of Python and how difficult it is to manage its dependency from project to project. Anaconda really helped me with that. The first machine-learning model that I deployed on the Live server was with Anaconda only. It was so managed that I only installed libraries from the requirement.txt file, and it started working. There was no need to manually install cuda or tensor flow as it was a very difficult job at that time. Graphical data modeling also provides tools for it, and they can be easily saved to the system and used anywhere.
Read full review
Lightning Tools
No answers on this topic
Support Rating
Anaconda
Anaconda provides fast support, and a large number of users moderate its online community. This enables any questions you may have to be answered in a timely fashion, regardless of the topic. The fact that it is based in a Python environment only adds to the size of the online community.
Read full review
Lightning Tools
No answers on this topic
Alternatives Considered
Anaconda
I have experience using RStudio oustide of Anaconda. RStudio can be installed via anaconda, but I like to use RStudio separate from Anaconda when I am worin in R. I tend to use Anaconda for python and RStudio for working in R. Although installing libraries and packages can sometimes be tricky with both RStudio and Anaconda, I like installing R packages via RStudio. However, for anything python-related, Anaconda is my go to!
Read full review
Lightning Tools
Lightning Tools Data Viewer is much easier and more powerful than Infowise similar viewer in their lineup. In this case, we use Data Viewer over the one offered by Infowise.
Read full review
Return on Investment
Anaconda
  • It has helped our organization to work collectively faster by using Anaconda's collaborative capabilities and adding other collaboration tools over.
  • By having an easy access and immediate use of libraries, developing times has decreased more than 20 %
  • There's an enormous data scientist shortage. Since Anaconda is very easy to use, we have to be able to convert several professionals into the data scientist. This is especially true for an economist, and this my case. I convert myself to Data Scientist thanks to my econometrics knowledge applied with Anaconda.
Read full review
Lightning Tools
  • It allows us to do things that would take a great deal more time to duplicate in SharePoint
  • It cuts down on ugly looking built in SP list layouts
  • Users find it easy to access, thus this product is more productive
Read full review
ScreenShots

Lightning Tools Data Viewer Screenshots
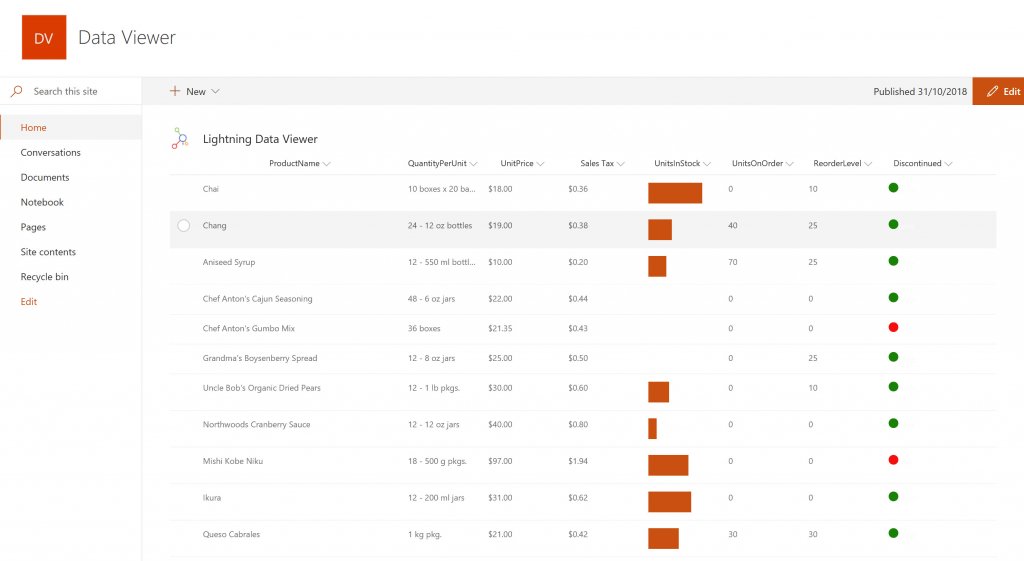
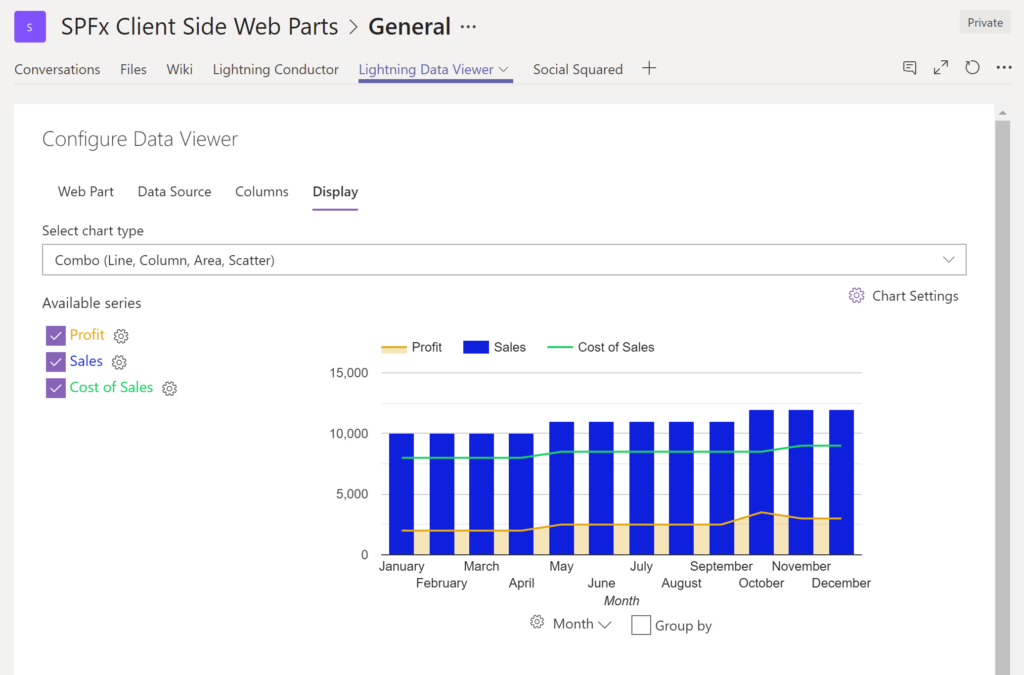
Screenshot of DISPLAYING EXTERNAL DATA WITHIN SHAREPOINT OR MICROSOFT TEAMS
The Data Viewer Client Side Web Part can be configured by Business Users within a few minutes to display Line of Business Data from Data Sources such as Excel,  SQL Azure, Business Connectivity Services, OData and SharePoint Lists.  Connections to an organizations data such as Customer Relationship Management Systems, Accounting Systems, or Custom Databases can be connected, giving business users a live up-to-date view of business information within the context of their SharePoint Team Sites or Microsoft Teams Tabs.Screenshot of HIGHLIGHTING KEY BUSINESS DATA (NO CODE)
Conditional formatting can be used to highlight key business data. Overdue Tasks, Low Stock, Currency Exchange Rates, Sales Revenue are examples of data to highlight visually allowing for a quick reaction time. Key Financial Indicators and Key Performance Indicators can be configured with a simple dialog and no need to write any code. Choose colours, icons or data bars to highlight key data.Screenshot of SELECTING AND STYLING ICONS
Icons can be chosen as part of the conditional formatting to make data stand out. The Office 365 Fabric icons can be selected and styled and applied to cell values. Pepper pots, Smileys, Envelopes and more icons are available. There are hundreds of options to choose from to highlight data that needs to be acted upon.Screenshot of DATA VIEWER CAN BE A GRID OF DATA OR A CHART IN SHAREPOINT OR MICROSOFT TEAMS
The Data Viewer can be used within Microsoft SharePoint Modern Sites or Microsoft Teams Tabs as a Grid of Data with styling or as a Chart which can be configured. The Charting Feature allows for Pie, Donut, Column, Line, Area, and Scatter Charts which can all be configured and displayed in 2D or 3D.Screenshot of TREEMAPS
summary information can be displayed within a TreeMap next to the detail. Users will be able to see trends, and how the business is performing  using the TreeMap view of data.Screenshot of CHARTS AND GAUGES
The Data Viewer is used to represent data in multiple ways using Gauges, TreeMaps, Multiple Series Charts, and Pie Charts.