AppNeta vs. Grafana Cloud

Overview
ProductRatingMost Used ByProduct SummaryStarting Price
AppNeta
Score 8.0 out of 10
Enterprise companies (1,001+ employees)
AppNeta provides performance monitoring solutions for distributed, cloud-connected, digital enterprises. AppNeta’s SaaS-based solutions give IT teams application and network performance data, allowing them to constantly monitor user experience across any application, network, data center or cloud.N/A
Grafana Cloud
Score 8.7 out of 10
N/A
Grafana Cloud is a fully managed Observability Platform designed to aggregate, visualize, and analyze telemetry data across distributed architectures. The platform provides a unified environment for Metrics, Logs, Traces, and Continuous Profiling, utilizing the LGTM (Loki, Grafana, Tempo, Mimir) and Pyroscope stack to provide high-cardinality analysis of system state.
$0
Pricing
AppNetaGrafana Cloud
Editions & Modules
No answers on this topic
Grafana Cloud - Pro
$8
per month up to 1 active user
Grafana Cloud - Free
Free
10k metrics + 50GB logs + 50GB traces up to 3 active users
Grafana Cloud - Advanced
Volume Discounts
custom data usage custom active users
Grafana - Enterprise Stack
Custom Pricing
Offerings
Pricing Offerings
AppNetaGrafana Cloud
Free Trial
NoYes
Free/Freemium Version
NoYes
Premium Consulting/Integration Services
NoNo
Entry-level Setup FeeNo setup feeNo setup fee
Additional Details
More Pricing Information
Community Pulse
AppNetaGrafana Cloud
Best Alternatives
AppNetaGrafana Cloud
Small Businesses
SolarWinds Pingdom
SolarWinds Pingdom
Score 8.2 out of 10
Amazon CloudWatch
Amazon CloudWatch
Score 7.8 out of 10
Medium-sized Companies
Cisco ThousandEyes
Cisco ThousandEyes
Score 9.1 out of 10
ManageEngine Site24x7
Score 10.0 out of 10
Enterprises
Nexthink
Nexthink
Score 7.4 out of 10
ManageEngine Site24x7
Score 10.0 out of 10
All AlternativesView all alternativesView all alternatives
User Ratings
AppNetaGrafana Cloud
Likelihood to Recommend
6.0
(2 ratings)
9.4
(7 ratings)
Usability
-
(0 ratings)
9.6
(3 ratings)
Support Rating
5.0
(1 ratings)
-
(0 ratings)
User Testimonials
AppNetaGrafana Cloud
Likelihood to Recommend
Broadcom
AppNeta is awesome for getting site-to-site statistics or trying to find out why at 3 am every night, this server loses connectivity to another server in a different data center. But we have found the multiple bugs in the hardware hard to deal with when the devices are a 4-hour plane ride away and require someone to console into the device.
Read full review
Grafana Labs
Just about any organization with more than one server and more than one cluster as it scales very well. Configuration of the application takes time and finesse to fine tune to where the balance of load time and getting data quickly meets. The plugins add load time but fine tuning for the application to meet demand needs nailed down at implementation
Read full review
Pros
Broadcom
  • AppNeta provides detailed application availability & uptime.
  • AppNeta provides great longitudinal data regarding how the applications perform including an overall grade or "AppDex."
  • AppNeta sends notifications of service downtime that aids in technical dispatch.
Read full review
Grafana Labs
  • Alerting through many different medium as Slack, Email, Webhook etc
  • Beautiful and unlimited number of dashboards to view your metrics and tweak them as you please
  • Log aggregation and powerful Logql to filter and view your logs
  • Microservices monitoring
  • Large number of plugins and data sources to collect your metrics from almost anywhere
Read full review
Cons
Broadcom
  • Hardware has a lot of bugs.
  • Auto-updates cannot be turned off on the hardware, causing blips in monitoring.
Read full review
Grafana Labs
  • There are some settings which we can't configure from UI (Web Console).
  • We've open[ed] up configuration files in command line text editors and manually do the settings e.g. LDAP/SSO configuration.
  • In terms of visualization, it's best, but it doesn't support log analysis otherwise it could destroy business of all other visualization tools.
Read full review
Usability
Broadcom
No answers on this topic
Grafana Labs
It is infinitely flexible. If you can imagine it, Grafana can almost certainly do it. Usability may be in the eye of the beholder however, as there is time needed to curate the experience and get the dashboards customized to how it makes sense to you. I know one thing they are working on are more templates, based on data sources
Read full review
Support Rating
Broadcom
Timely support is one of AppNeta's strong suits. But the ability to develop permeant fixes for issues within there product is where they lack.
Read full review
Grafana Labs
No answers on this topic
Alternatives Considered
Broadcom
We currently use Nagios/GroundWork and Cacti to perform network monitoring. AppNeta's UI is far superior.
Read full review
Grafana Labs
Grafana blows Nagios out of the water when it comes to customization. The ability to feed almost any data source makes it very versatile and the cost is great.
Read full review
Return on Investment
Broadcom
  • A reduction in network outages and length of network outages.
  • More detailed post outage investigation available.
Read full review
Grafana Labs
  • Grafana has replaced many higher priced tools
  • The integrations are seemless with multiple backends
  • Combining graphs and dashboards from multiple data sources is a game changer
Read full review
ScreenShots

AppNeta Screenshots

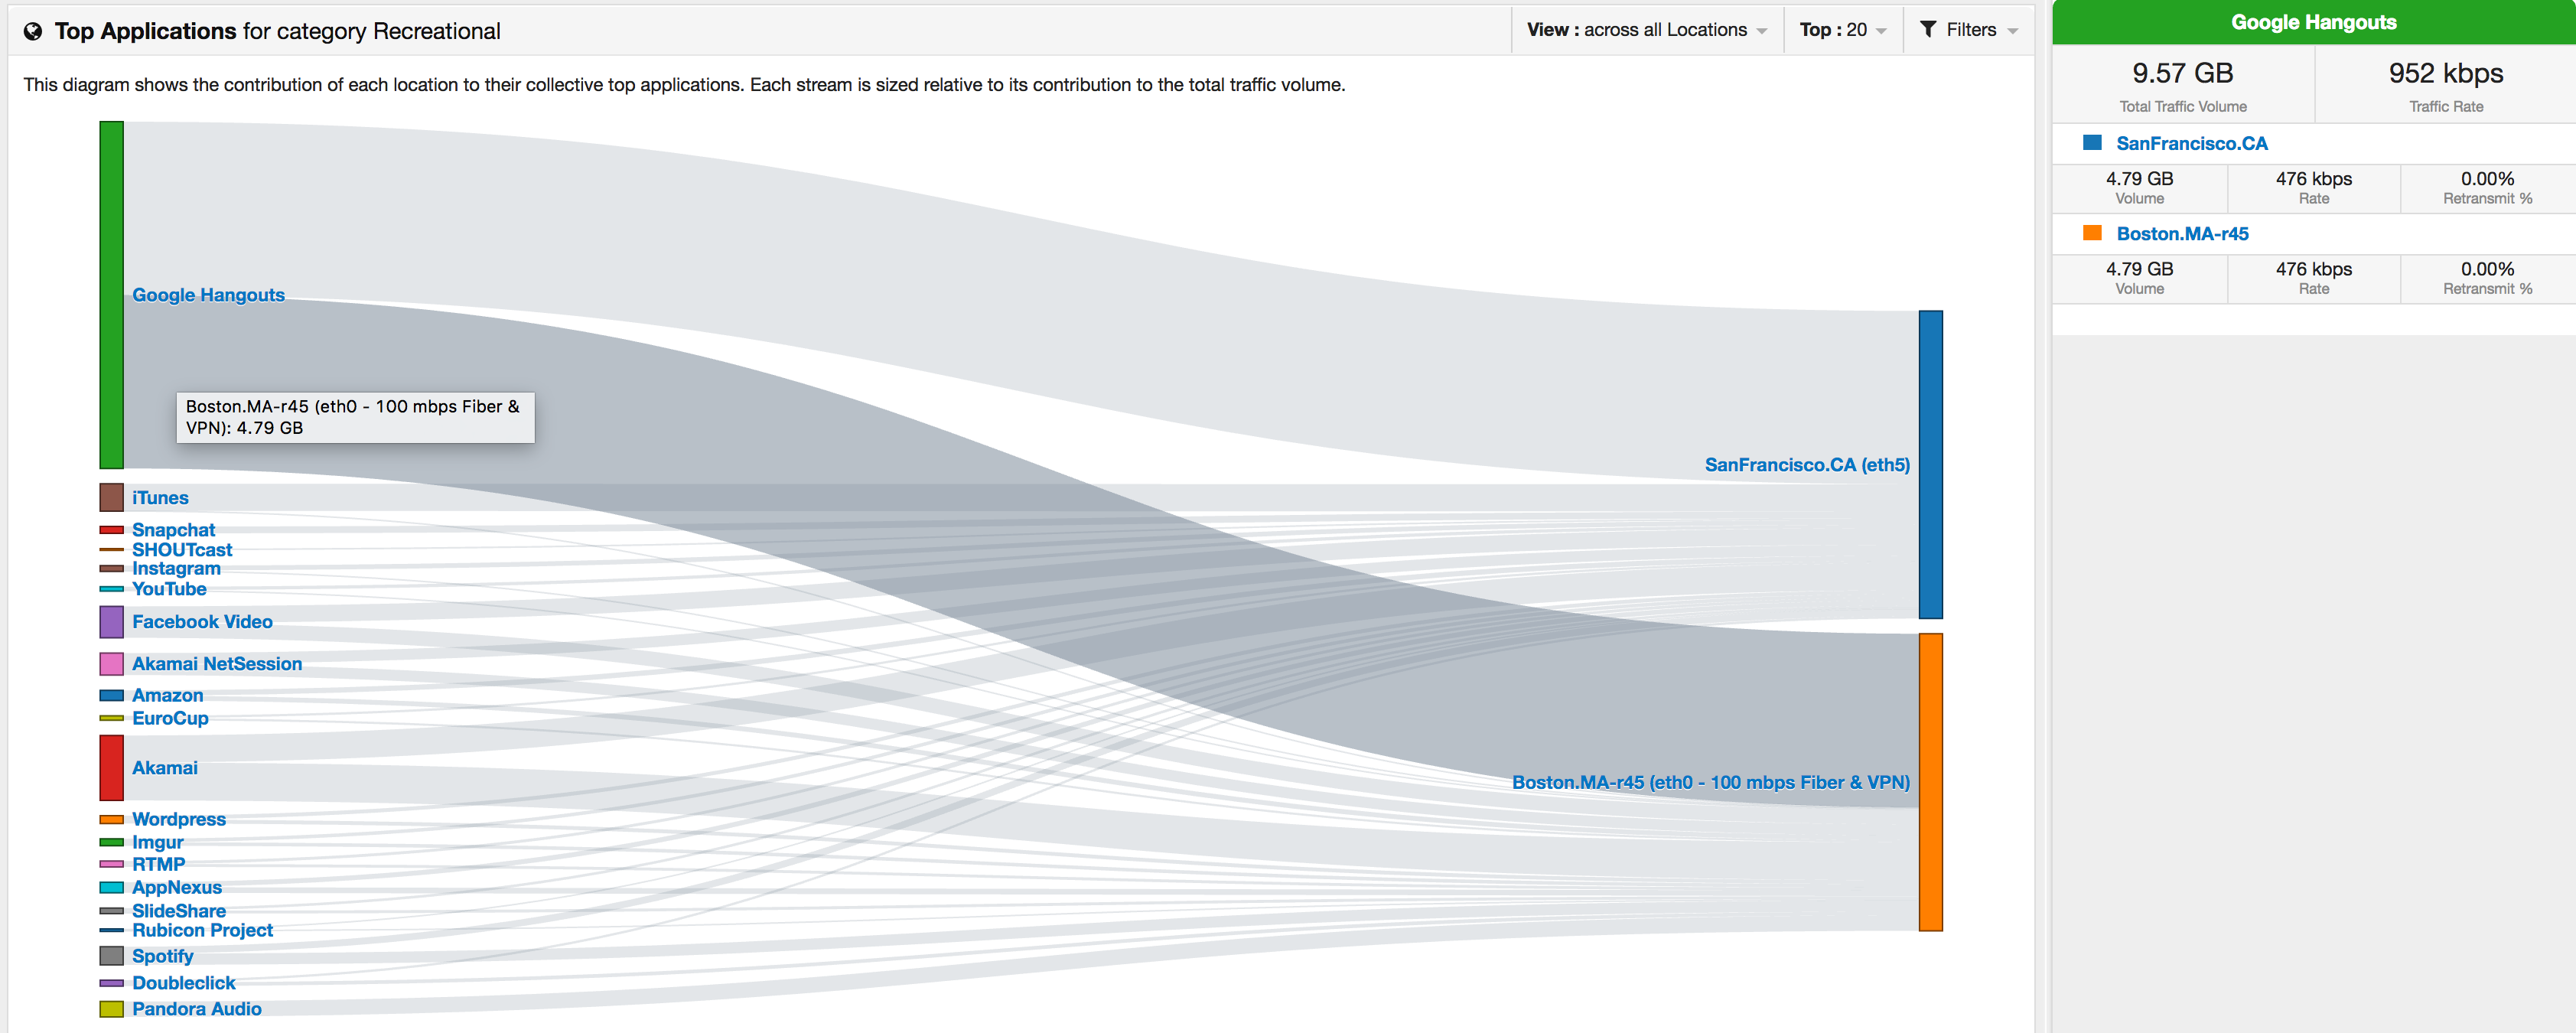
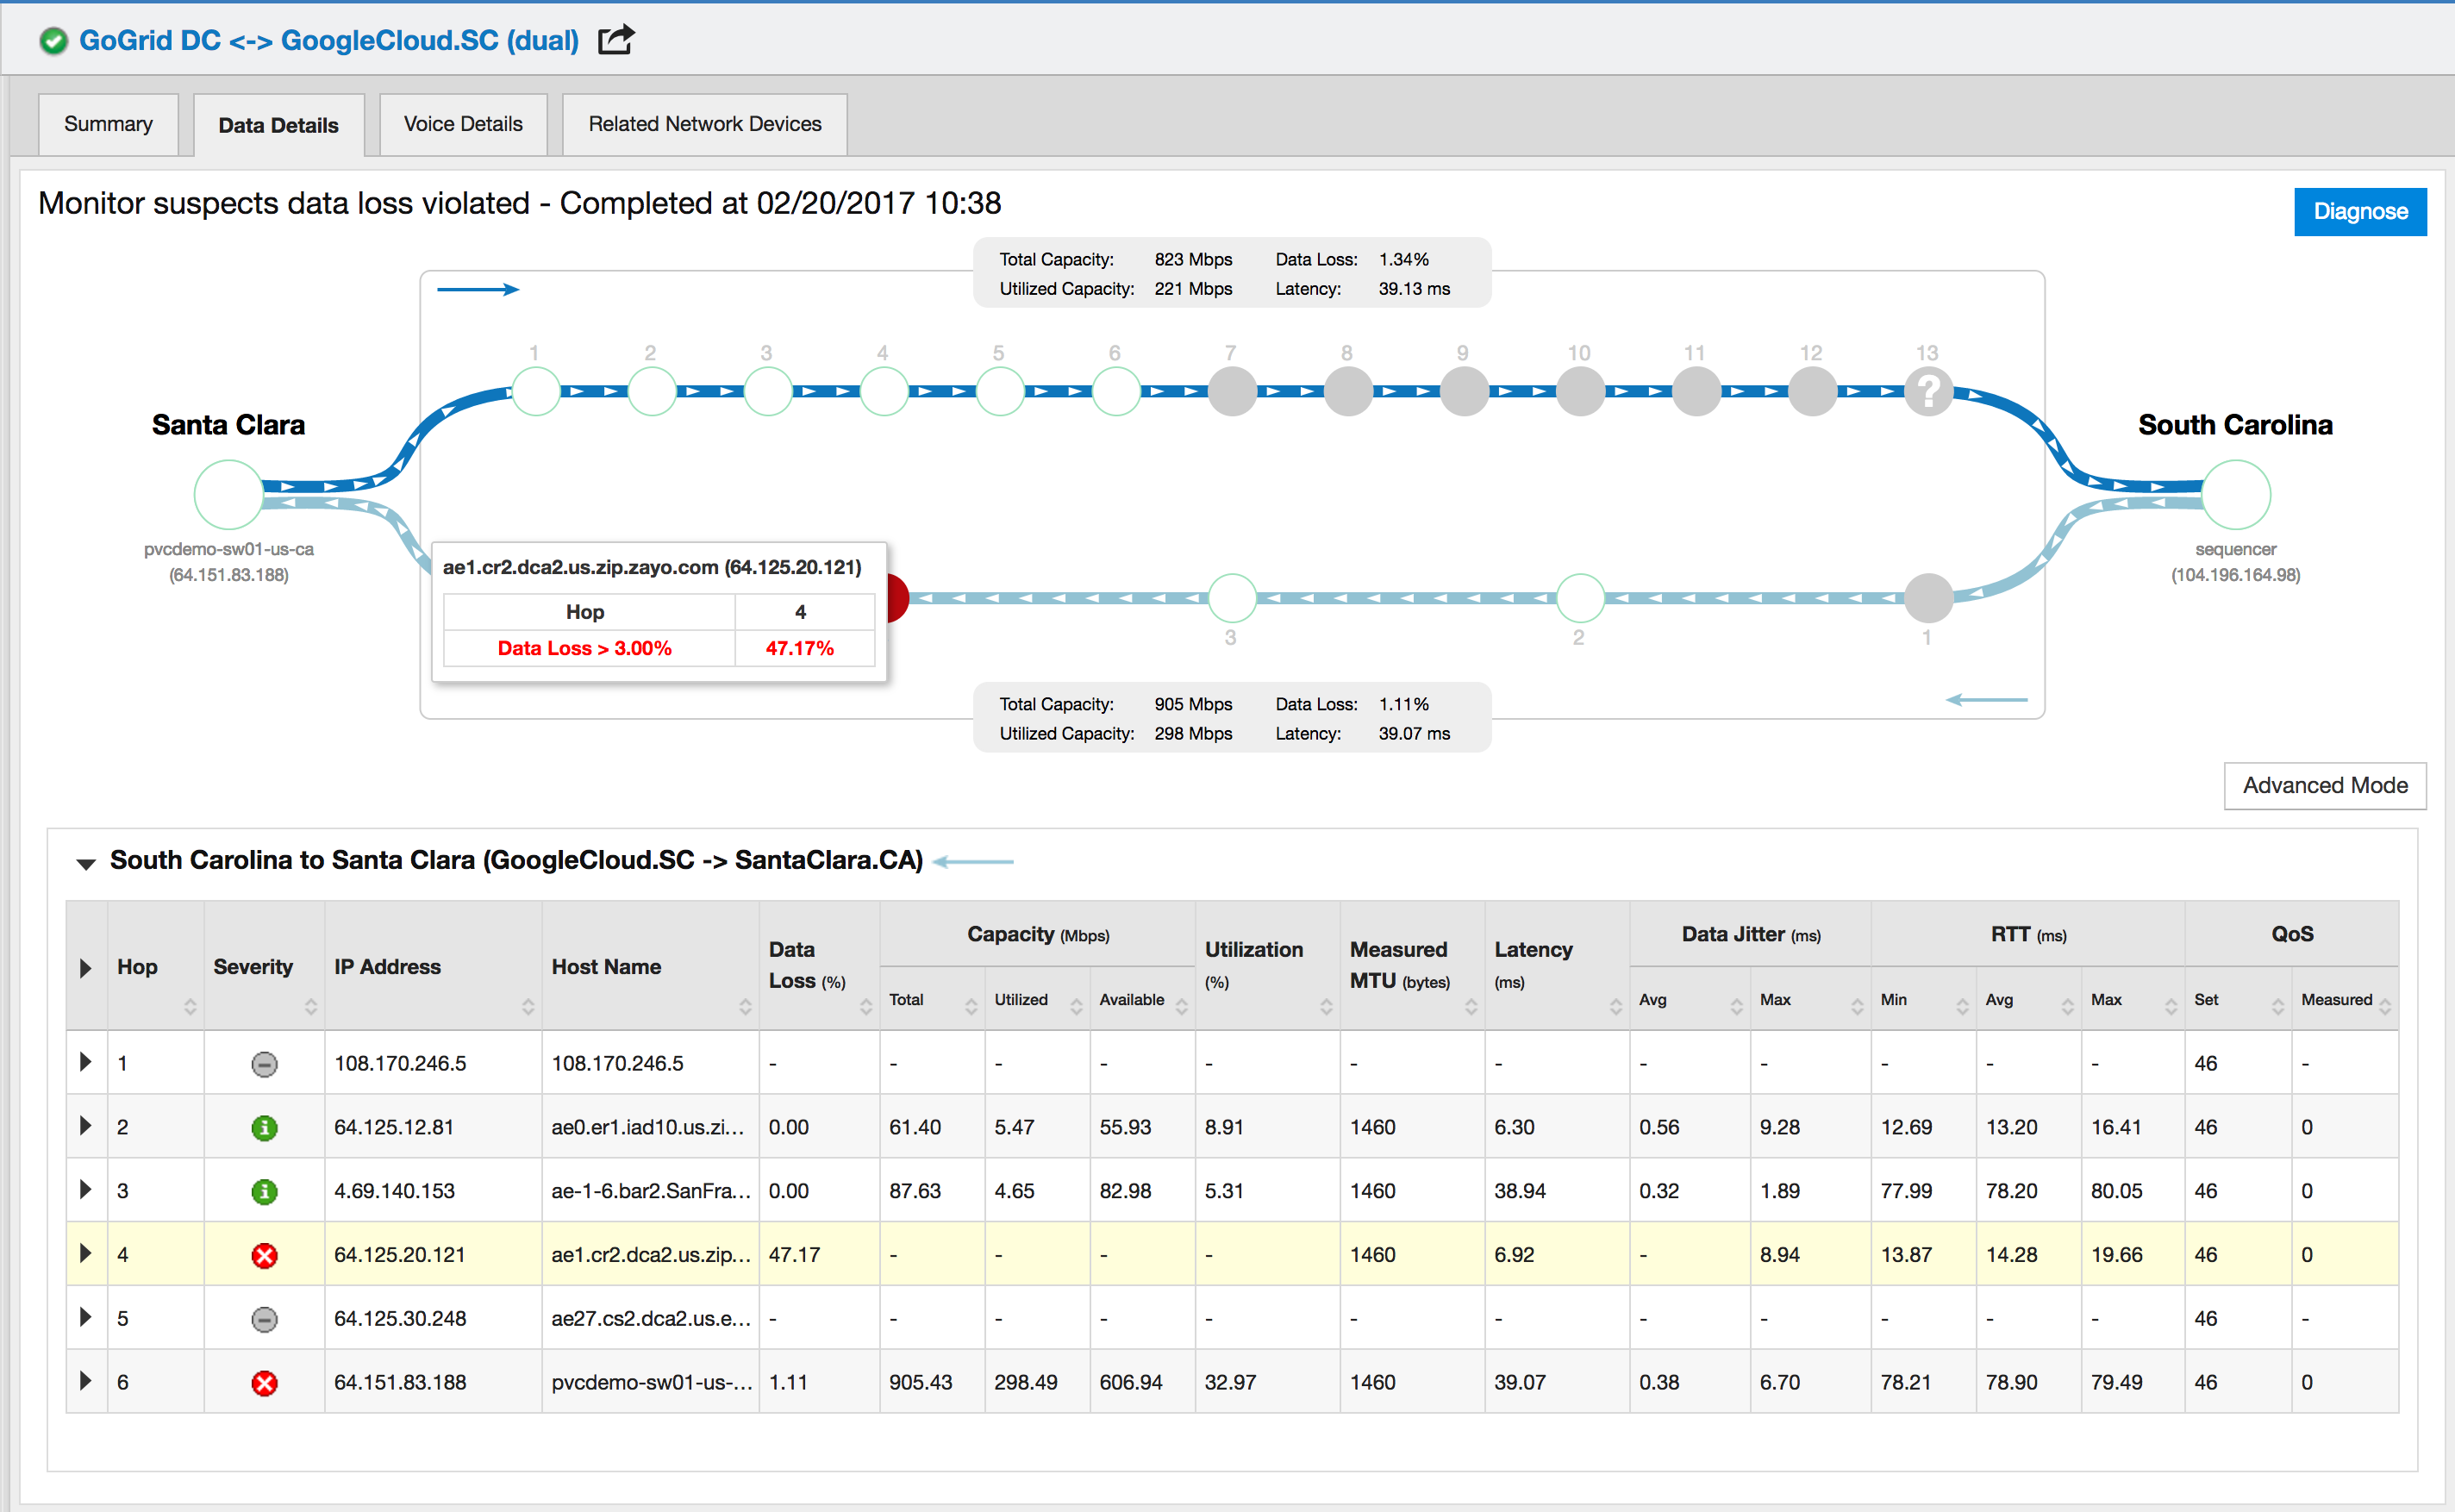
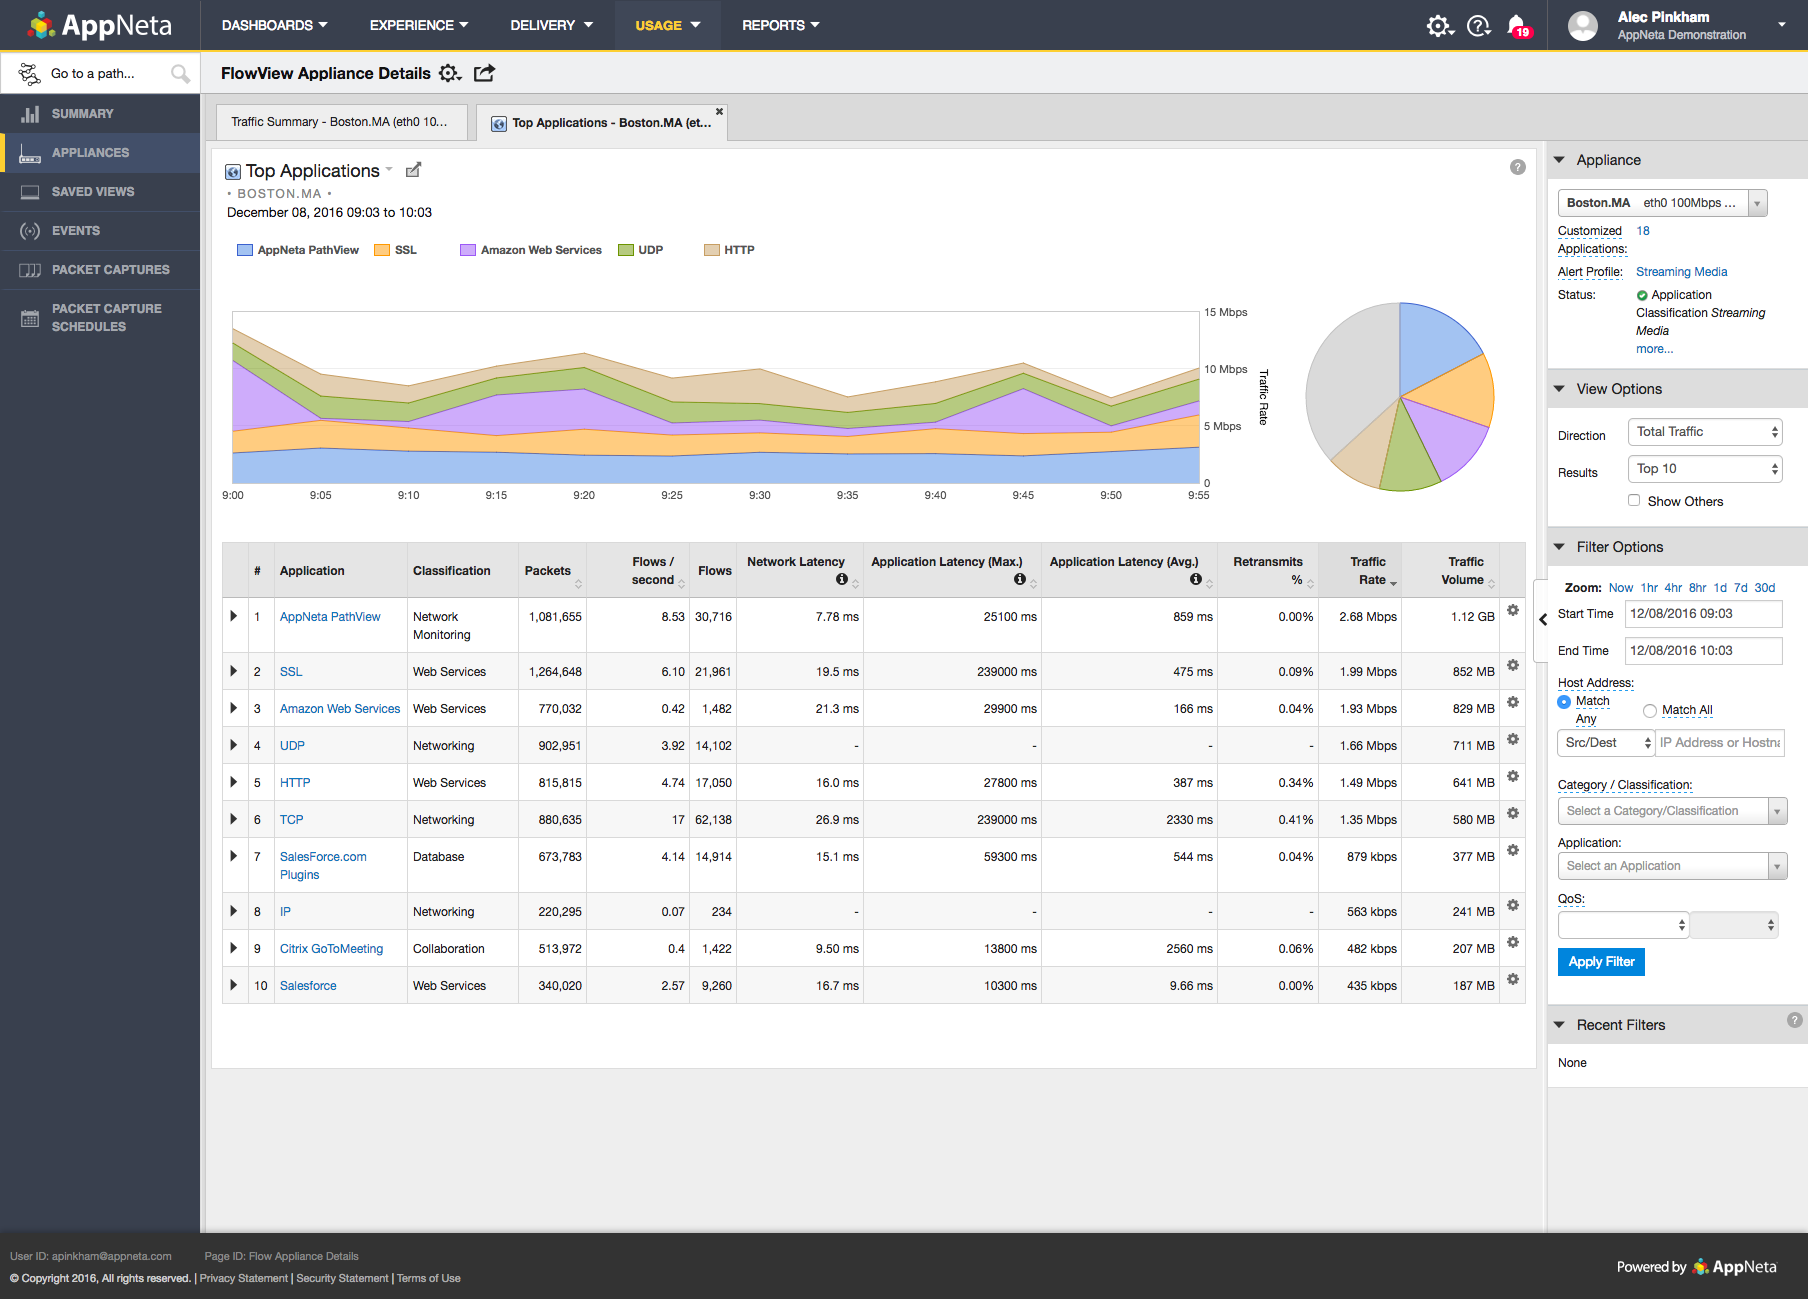
Screenshot of a visualization for monitoring what apps are in use on a network.Screenshot of AppNeta's in-depth diagnostics, used by IT Ops to identify the root cause of network and app performance issues.Screenshot of the enhanced Selenium scripting that can be used for web synthetic monitoring to benchmark and alert on performance for business-critical SaaS apps.Screenshot of monitoring of the actual application path with multi-protocol route determination for TCP, UDP and ICMP. Key network metrics can be tracked, like Latency, Loss, Capacity and Jitter continuously with AppNeta.Screenshot of how AppNeta correlates poor performance per host and--with Active Directory--with users.Screenshot of monitoring the usage of a network for recreational apps to see when they're stealing bandwidth from your business critical apps. Users can segment by location or app to drill into more details across the entire AppNeta Performance Manager dataset.