CartoDB is great for generating geographic visualizations of data where the geographies are well-defined. It would be great for analysts to develop visualizations of data with spatial elements. That being said, the software is limited if you want to do any real data munging or analysis, as it can be cumbersome to use and there isn't a great interface for actually saving the results of different manipulations (you can save it as a new file, but it's hard to do version control, etc.). I would recommend preparing the data outside of CartoDB and only using the tool for visualization once the data is well prepared.
A de minimis incentive was given to thank the reviewer for their time. The incentive was not used to bias or drive a particular response, nor was the incentive contingent on a positive endorsement. More Info
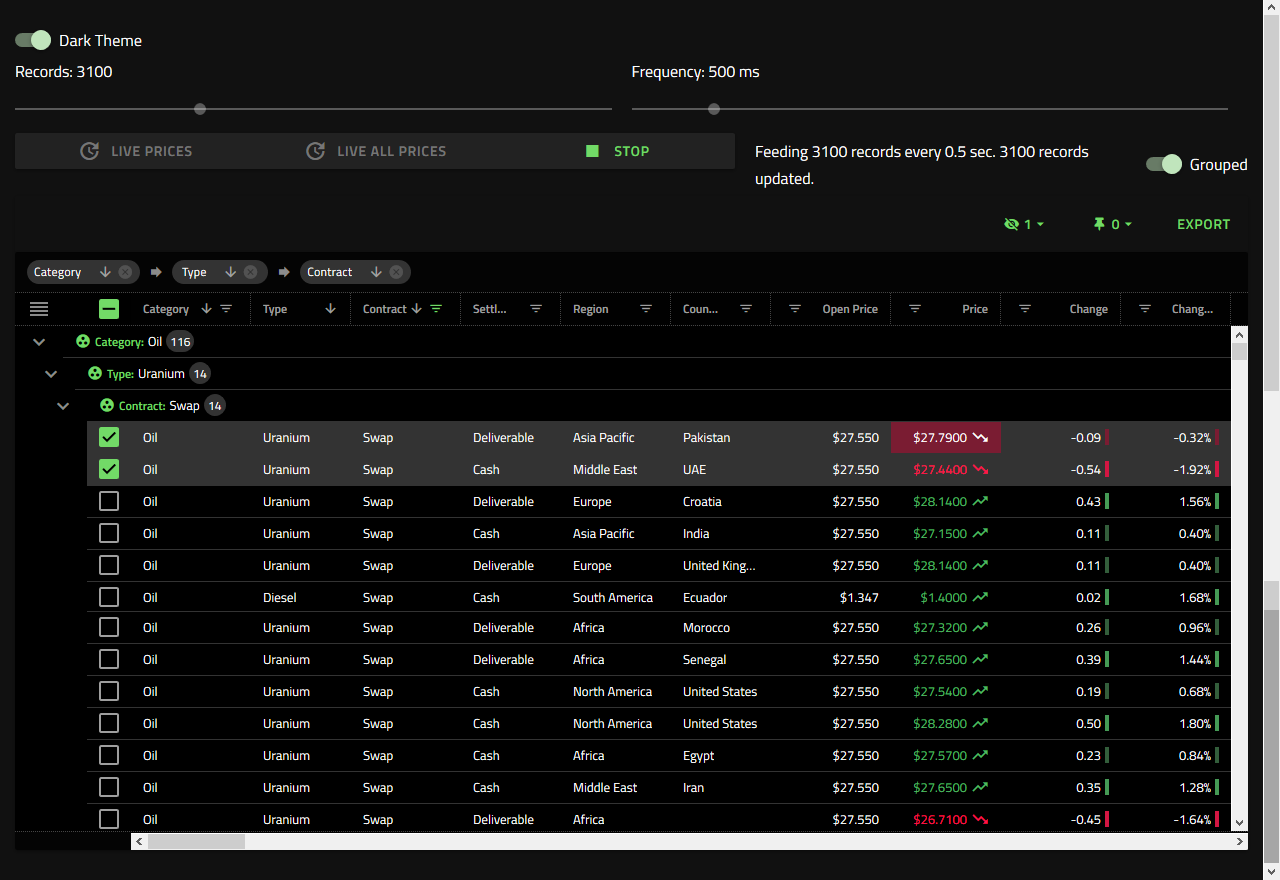
Angular is our framework of choice for a number of reasons. Business data is almost always displayed in a grid format. It makes sense to start with a strong widget that is powerful and fast when building applications. Ignite UI provides a complete toolset of widgets for other frameworks, but Angular is our focus. Ignite UI is helping us deliver a great UX/UI.
A de minimis incentive was given to thank the reviewer for their time. The incentive was not used to bias or drive a particular response, nor was the incentive contingent on a positive endorsement. More Info
It is amazing at allowing control of the visualizations. It takes a little bit to get used to but the combination of full SQL queries and CSS-like styling is very powerful.
The services are built on a robust stack of open source software. I was able to build a standalone instance of CartoDB relatively easily (after some research and trial and error).
Server side map rendering is key for handling large data sets. The way the images are returned makes them very easy to catch in an HTTP cache to minimize the hits to the server. The interactivity that CartoDB has built in makes this completely transparent to the end user, they can click on parts of the static images and be presented with popups or change map styles. It's a very clever implementation.
A de minimis incentive was given to thank the reviewer for their time. The incentive was not used to bias or drive a particular response, nor was the incentive contingent on a positive endorsement. More Info
A de minimis incentive was given to thank the reviewer for their time. The incentive was not used to bias or drive a particular response, nor was the incentive contingent on a positive endorsement. More Info
A de minimis incentive was given to thank the reviewer for their time. The incentive was not used to bias or drive a particular response, nor was the incentive contingent on a positive endorsement. More Info
A de minimis incentive was given to thank the reviewer for their time. The incentive was not used to bias or drive a particular response, nor was the incentive contingent on a positive endorsement. More Info
A de minimis incentive was given to thank the reviewer for their time. The incentive was not used to bias or drive a particular response, nor was the incentive contingent on a positive endorsement. More Info
We tried DevExpress when we started a project a couple of years ago. At the time, the documentation and ease of use went to Infragistics. When trying new or updated tools, the documentation and samples are everything. Having minimal documentation or documentation that seems to be written for people that already know how to use the product is just plain frustrating. Samples need to be something close to the real-life usage of the product.
A de minimis incentive was given to thank the reviewer for their time. The incentive was not used to bias or drive a particular response, nor was the incentive contingent on a positive endorsement. More Info
CartoDB definitely saves a lot of time when creating visualizations. Previously, I would use different software and have to make edits manually (or just create the visualizations manually to start with). I would say that the software definitely cuts the time required to create certain visualizations by a half or two-thirds.
A de minimis incentive was given to thank the reviewer for their time. The incentive was not used to bias or drive a particular response, nor was the incentive contingent on a positive endorsement. More Info
A de minimis incentive was given to thank the reviewer for their time. The incentive was not used to bias or drive a particular response, nor was the incentive contingent on a positive endorsement. More Info