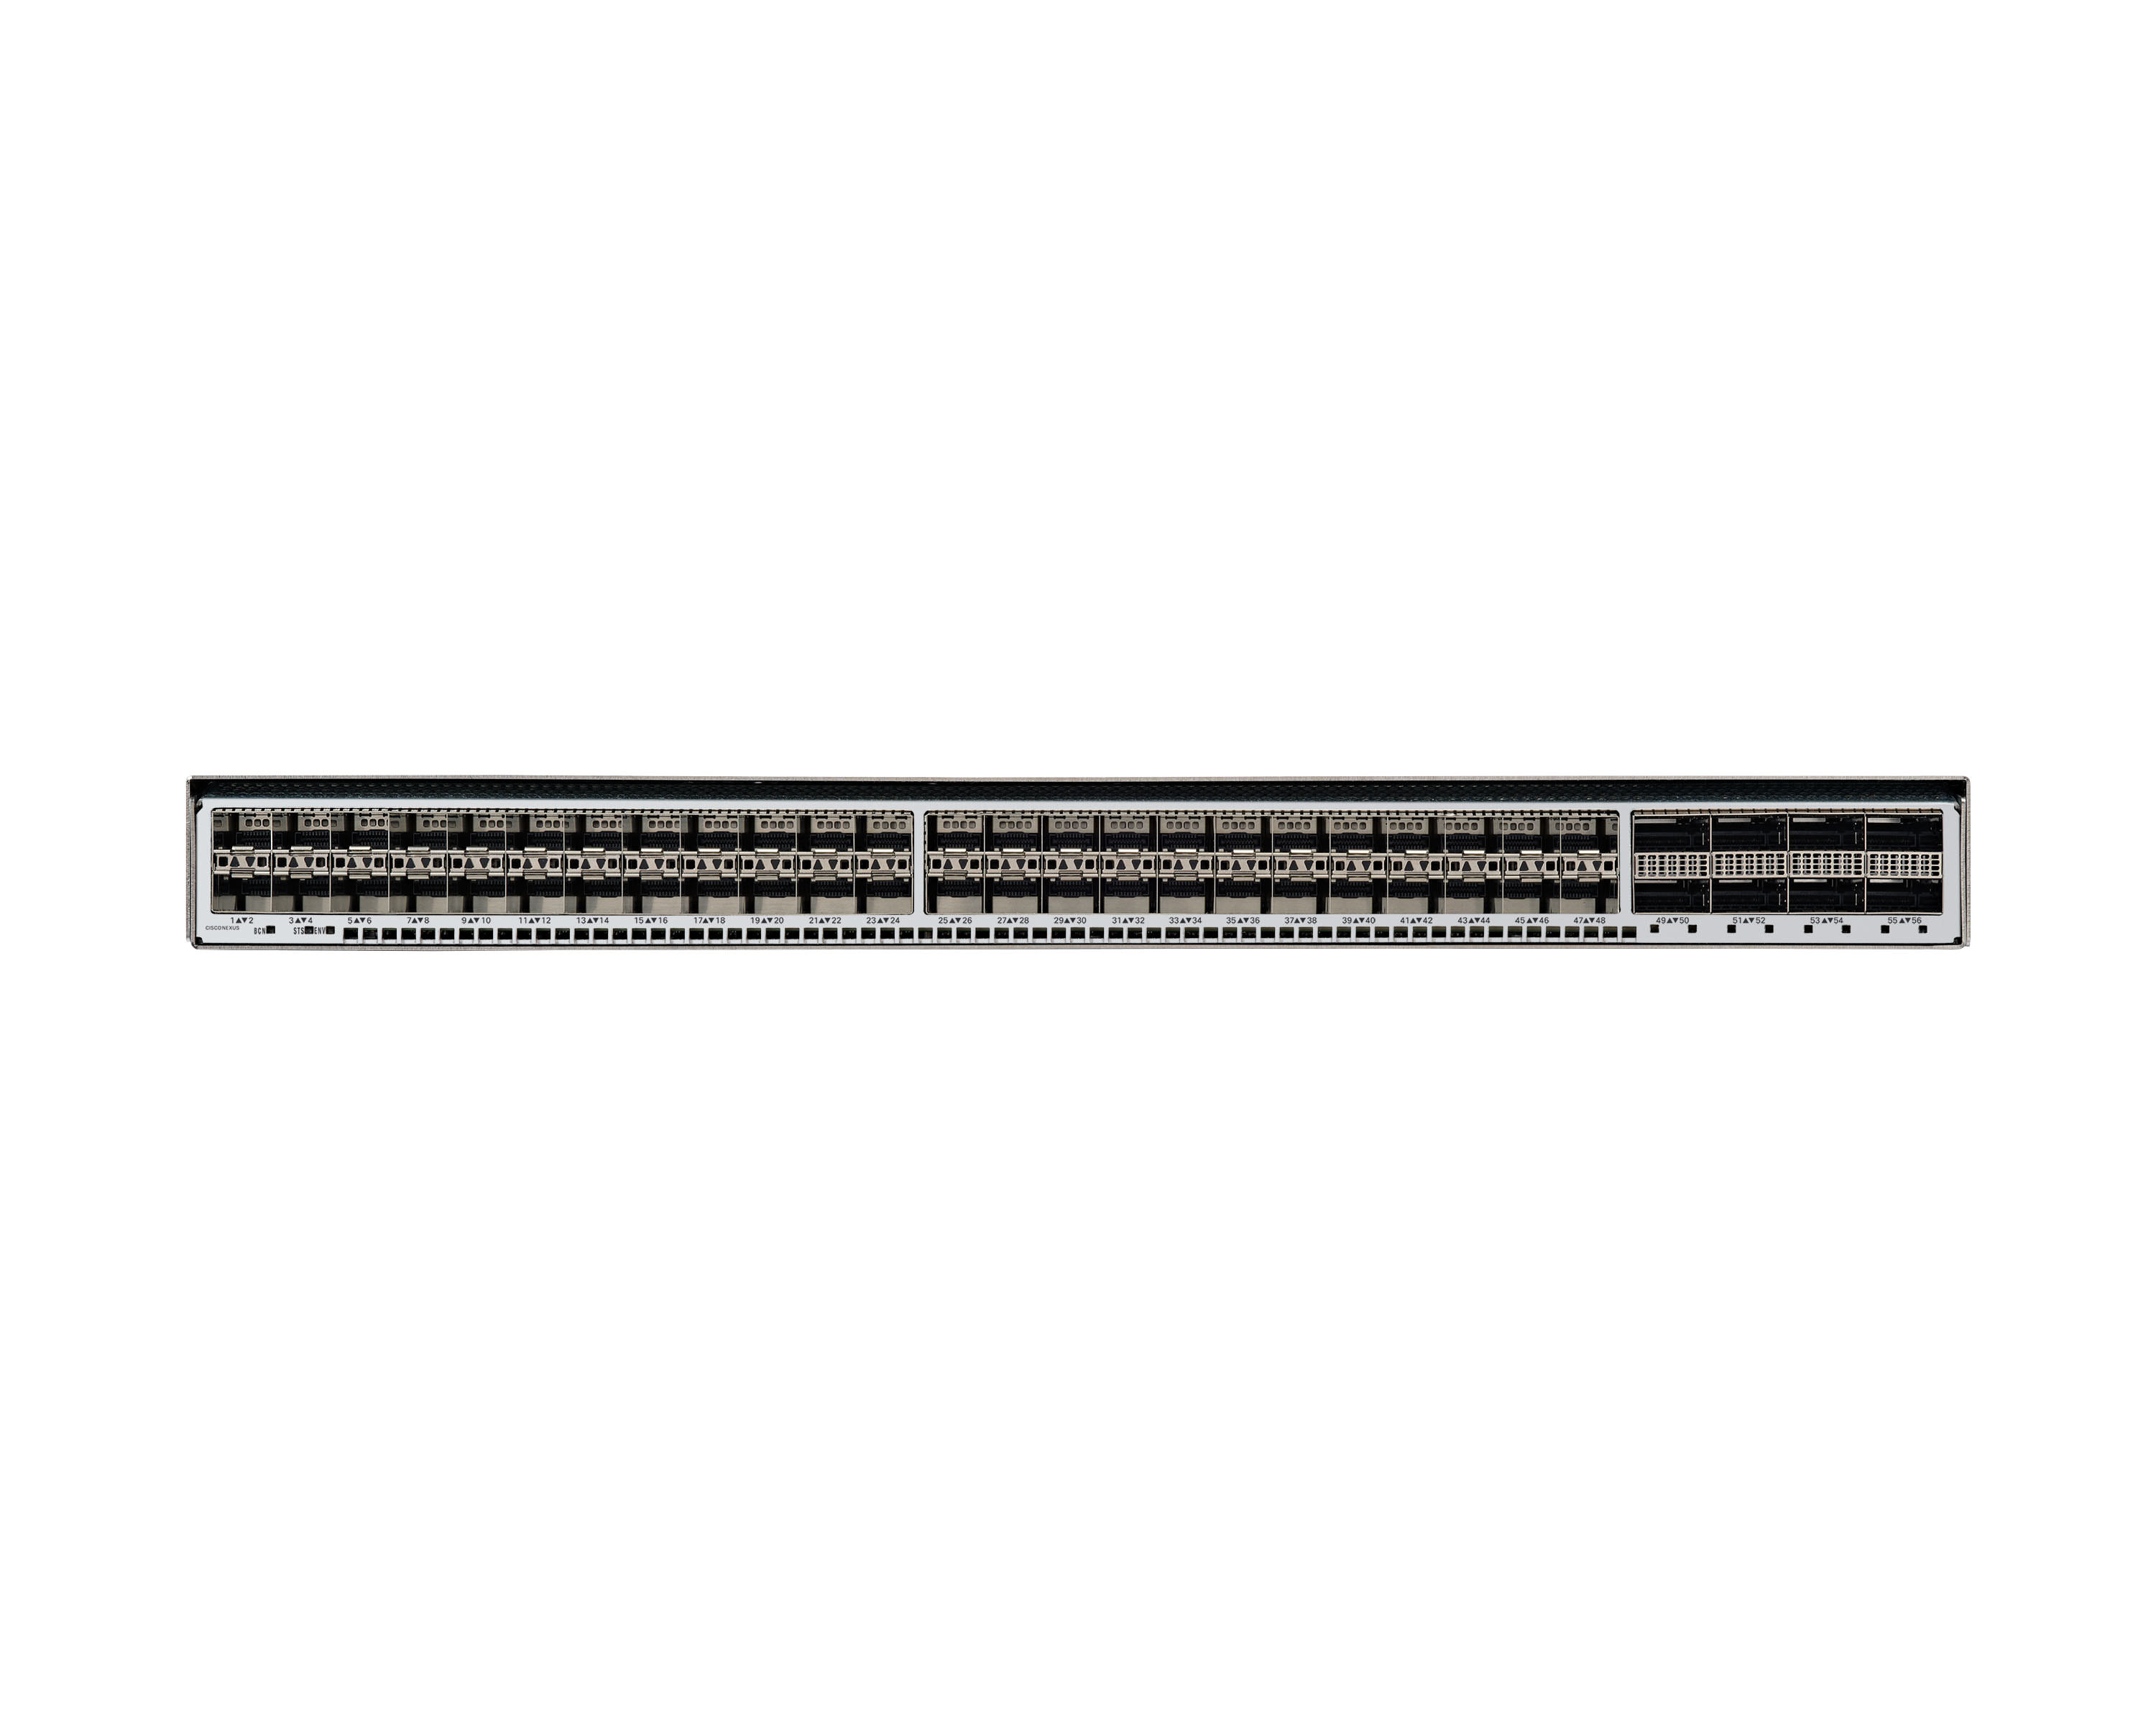
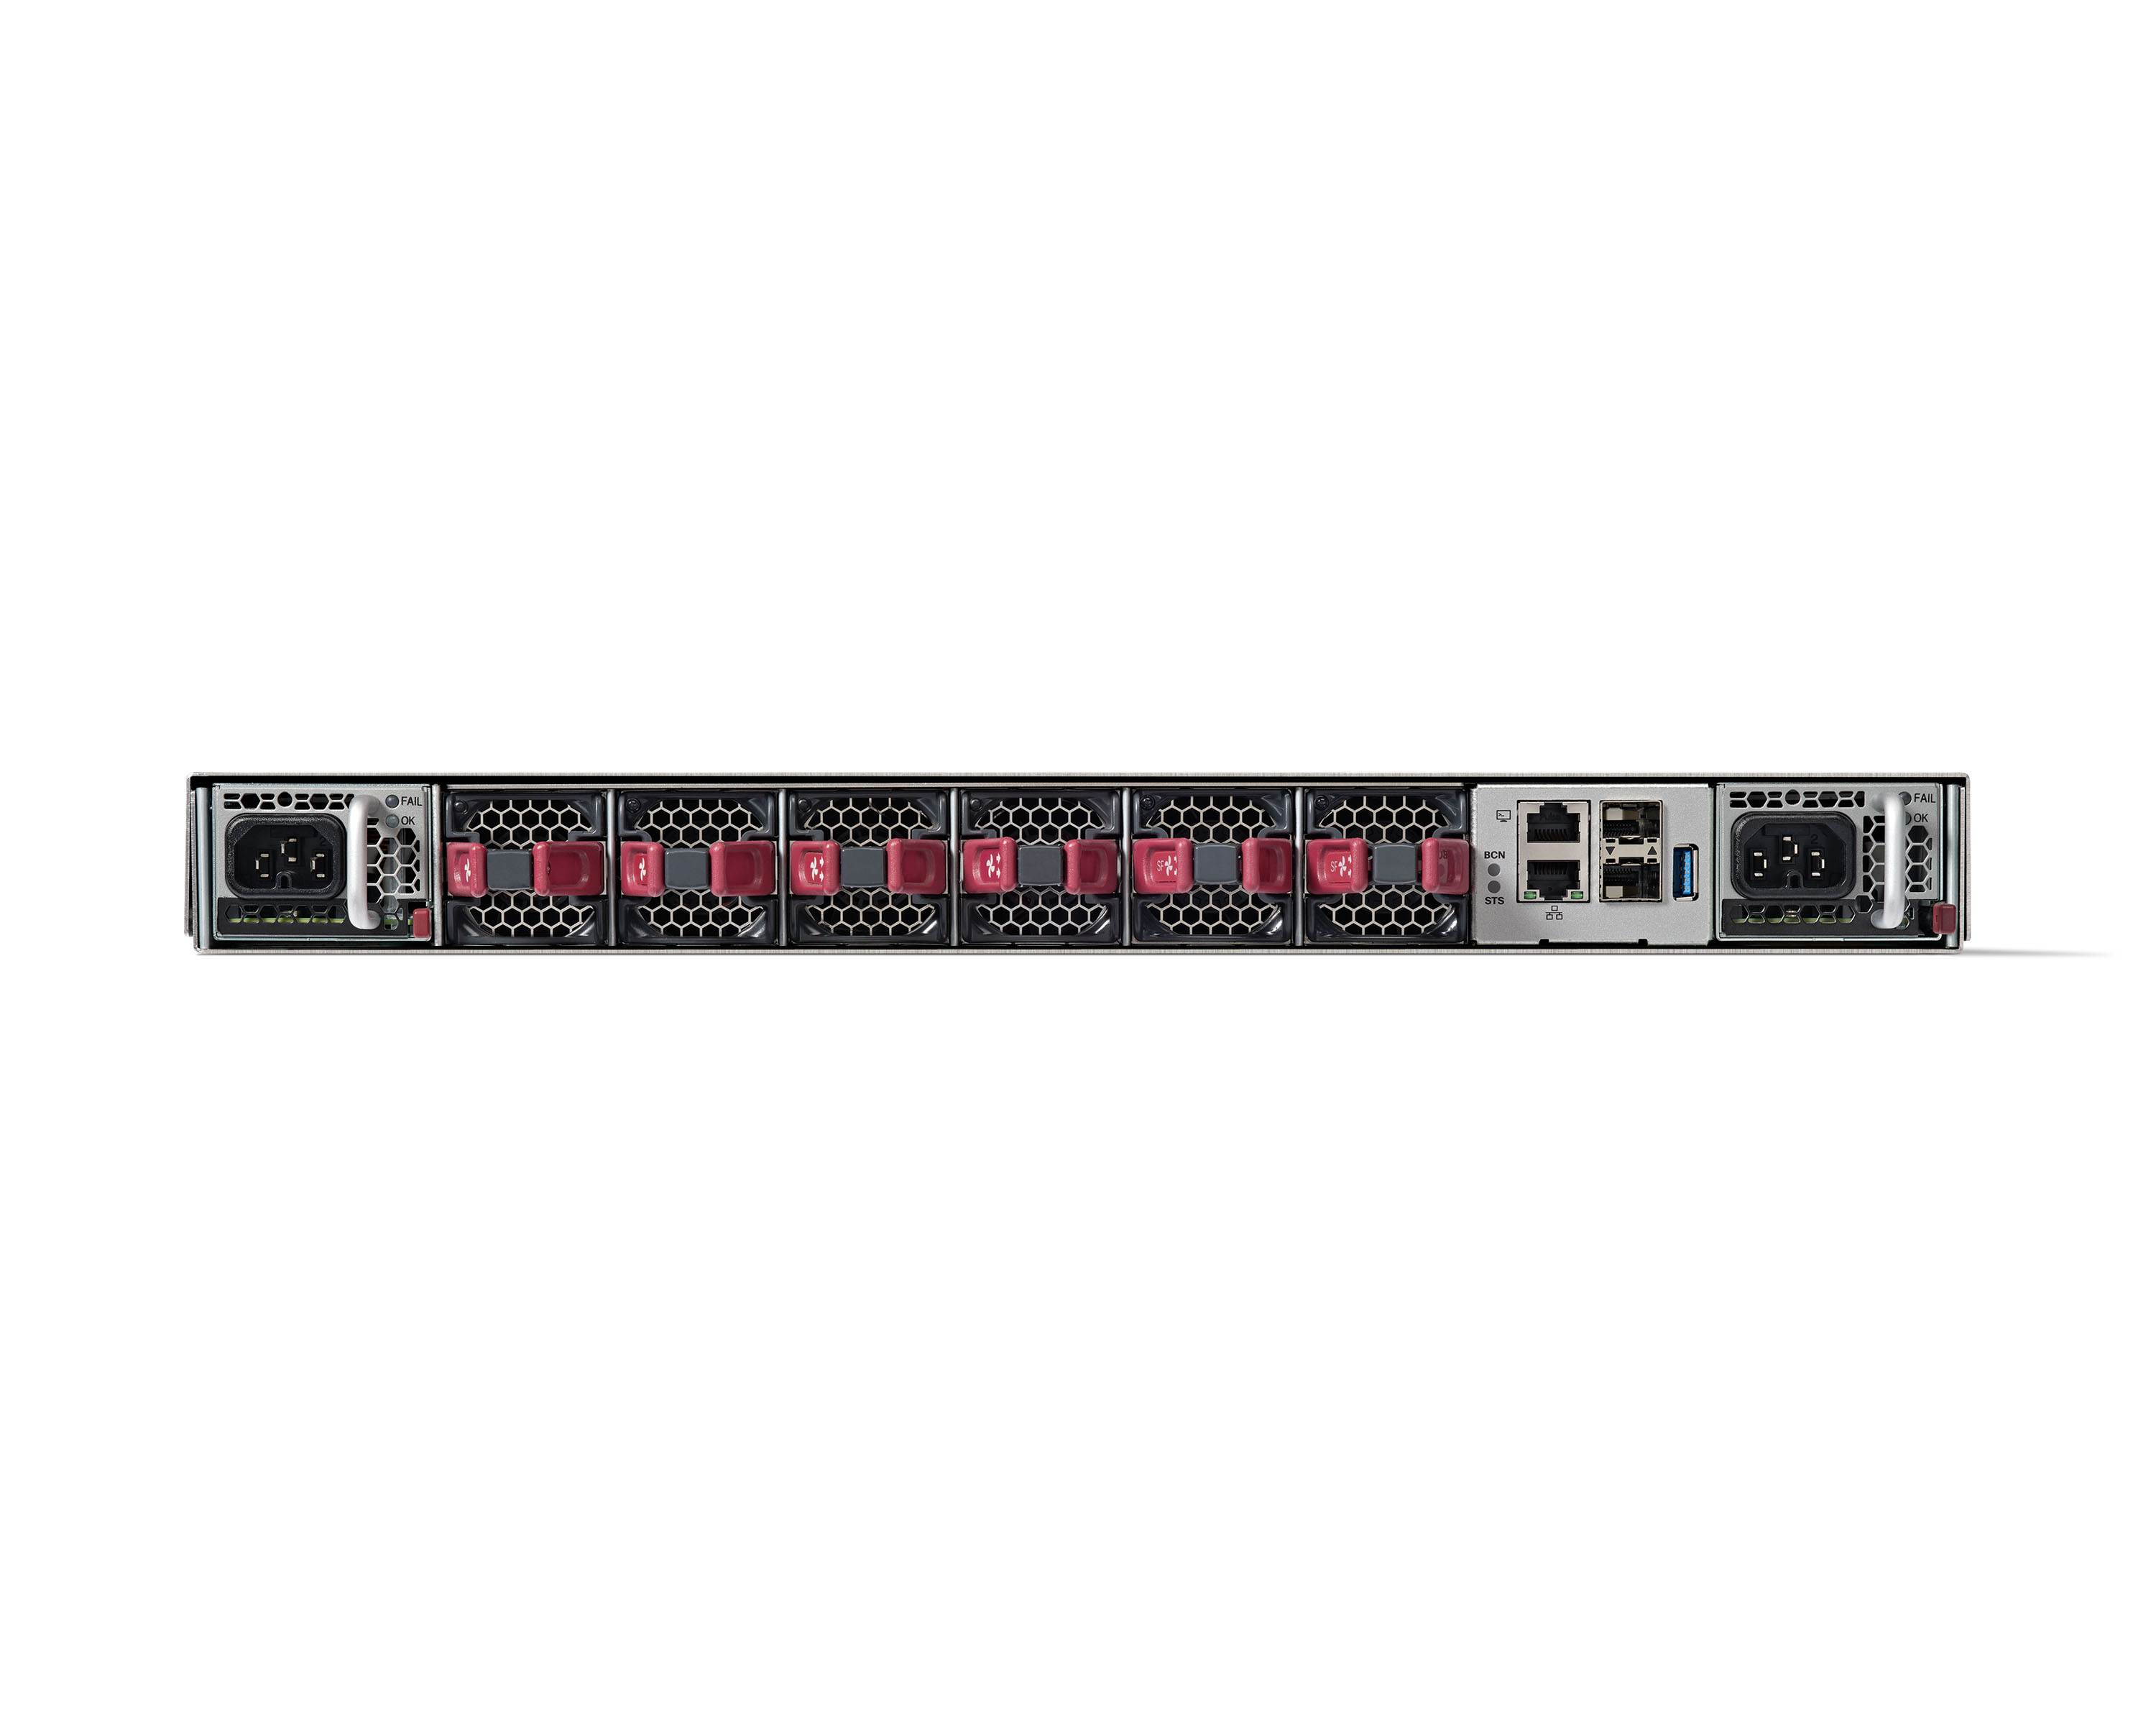
Cisco Nexus Dashboard simplifies data-center networks with automation and analytics. The data-center network helps organizations to meet business demands, and provision reliable data-center networking services as fast as possible, when and where organizations need it. As network infrastructure management is becoming more complex, diverse, and distributed, with multiple configuration points, monitoring tools, and vast amounts of data being generated every second. Cisco Nexus Dashboard is…
N/A
SolarWinds Engineer's Toolset
Score7.6 out of 10
N/A
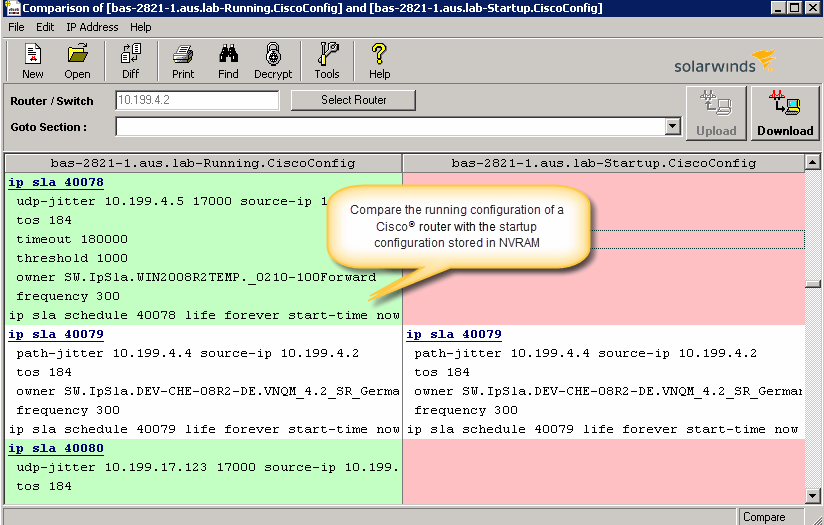
SolarWinds® Engineer’s Toolset (ETS) helps users monitor and troubleshoot a network with over 60 tools for network management. ETS allows users to monitor and receive alerts in real time on network availability and health, and perform network diagnostics for faster troubleshooting and resolution of complex
network issues. With ETS users can deploy an array of network discovery tools including Port Scanner, Switch Port Mapper or advanced Subnet Calculator, manage Cisco®
devices with specialized…
We used Cisco Nexus Dashboard specifically for automating the creation of networks in our private cloud environment using a VXLAN EVPN multisite environment. It integrates into Infoblox well. It's also very suited in network troubleshooting for past and present issues. Where I don't see it being used much is in the campus but it's nice to know we have the ability to add catalyst if needed.
A de minimis incentive was given to thank the reviewer for their time. The incentive was not used to bias or drive a particular response, nor was the incentive contingent on a positive endorsement. More Info
I have found the toolset especially useful for scanning subnets to discover devices, and for setting up temporary real-time monitors when we are troubleshooting or setting up new connections. The most useful aspect has been the ability to apply the tools to help troubleshoot and pinpoint intermittent issues. More general tools like Orion often do not have the granularity to detect issues like intermittent packet loss which are especially impactful to applications like Voice. The toolset gives us another level of capability to dig into issues.
A de minimis incentive was given to thank the reviewer for their time. The incentive was not used to bias or drive a particular response, nor was the incentive contingent on a positive endorsement. More Info
A de minimis incentive was given to thank the reviewer for their time. The incentive was not used to bias or drive a particular response, nor was the incentive contingent on a positive endorsement. TR verified that a representative sample of customers was invited. More Info
A de minimis incentive was given to thank the reviewer for their time. The incentive was not used to bias or drive a particular response, nor was the incentive contingent on a positive endorsement. More Info
With the latest version release of Cisco Nexus Dashboard to version 3.0.1 I can say that most of the features have already improved but one of the wishlists that I want for ND is the possibility of extracting lists of Anomaly.
Include older versions of Firmware in the list of choices when doing the firmware upgrade analysis, currently only the recommended is in the list of choices.
If possible, include all the prechecks in the Firmware pre-upgrade analysis same in the script provided by Cisco.
The unifying component that is intended to be the initial interface to the tools seems clunky. I prefer to start the tools individually rather than using it.
The port scanner could use some improvements to make it easier to use.
A de minimis incentive was given to thank the reviewer for their time. The incentive was not used to bias or drive a particular response, nor was the incentive contingent on a positive endorsement. More Info
We observe significant product development with each release, along with substantial expansion of functionality. The program code has been consolidated into a single image, which simplifies installation and routine system update operations. Additionally, it is possible to install it outside the production network, which further enhances the solution’s availability.Additionally, the new graphical interface is very simplified and user-friendly.
A de minimis incentive was given to thank the reviewer for their time. The incentive was not used to bias or drive a particular response, nor was the incentive contingent on a positive endorsement. More Info
For the end user, it is relatively easy to use. However, some training and practice is a must because the NSO is not as straightforward as the traditional router CLI. For the administrator, Cisco Network Service Orchestrator (NSO) is just like another program running on the Linux system--there is no big difference.
A de minimis incentive was given to thank the reviewer for their time. The incentive was not used to bias or drive a particular response, nor was the incentive contingent on a positive endorsement. More Info
A de minimis incentive was given to thank the reviewer for their time. The incentive was not used to bias or drive a particular response, nor was the incentive contingent on a positive endorsement. More Info
For us, it's not yet a single pane of glass for the ACI network as Network Assurance Engine is not yet integrated into the [Cisco] Nexus Dashboard. This will be the case after the next update we plan to do. Today it's a tool I use daily to figure out if something unusual or unexpected happened in the SDN part of our network. The legacy network is still monitored with different tools.
A de minimis incentive was given to thank the reviewer for their time. The incentive was not used to bias or drive a particular response, nor was the incentive contingent on a positive endorsement. More Info
here was never a need to contact support, as the system includes several commands that allow for self-healing. Even if, after the upgrade process, one of the processes was not running, I was able to quickly find the appropriate sequence of commands that definitively resolved the issue. The entire architecture was designed in such a way as to be resilient to the failure of one node in a three-server setup.
A de minimis incentive was given to thank the reviewer for their time. The incentive was not used to bias or drive a particular response, nor was the incentive contingent on a positive endorsement. More Info
A de minimis incentive was given to thank the reviewer for their time. The incentive was not used to bias or drive a particular response, nor was the incentive contingent on a positive endorsement. More Info
Honestly, the product implementation took 1–2 days to comprehensively manage the client’s entire infrastructure. The delivered on-premise solution, provided as physical servers, quickly builds the required environment in which individual data centers are rapidly added. The data collection process takes some time but also depends on the number of devices in the network.
A de minimis incentive was given to thank the reviewer for their time. The incentive was not used to bias or drive a particular response, nor was the incentive contingent on a positive endorsement. More Info
The Cisco Nexus Series switches perform admirably in our blended distributed system. We have been dealing with any of these sorts of switches for over 5 years and have been exceptionally happy with their functionality. Several of our other computer networks in our data rooms have proved effective with Cisco equipment. Because of the simplicity of maintenance and the high quality of technical support provided by Cisco representatives, there is a high level of trust in these switches.
A de minimis incentive was given to thank the reviewer for their time. The incentive was not used to bias or drive a particular response, nor was the incentive contingent on a positive endorsement. More Info
I haven't compared any tools similar to SolarWinds Engineer's Toolset. This might be because I'm pretty biased when it comes to monitoring, and reporting solutions. I've found that SolarWinds provides the biggest bang for the buck in my opinion. I'm sure there are other solutions on the market that compete, but I haven't tried any of them because I've been very satisfied with SolarWinds.
A de minimis incentive was given to thank the reviewer for their time. The incentive was not used to bias or drive a particular response, nor was the incentive contingent on a positive endorsement. More Info
It's a very secure platform that can manage all the business networks, monitor various network traffic, and is easy project management software. Cisco Nexus Dashboard Fabric Controller can centralize all the network traffic in one room for easy and secure management and threat detection capability and even the secure channels offered are excellent.
A de minimis incentive was given to thank the reviewer for their time. The incentive was not used to bias or drive a particular response, nor was the incentive contingent on a positive endorsement. More Info
A de minimis incentive was given to thank the reviewer for their time. The incentive was not used to bias or drive a particular response, nor was the incentive contingent on a positive endorsement. More Info