Clear Analytics vs. Google Charts

Overview
ProductRatingMost Used ByProduct SummaryStarting Price
Clear Analytics
Score 8.8 out of 10
Enterprise companies (1,001+ employees)
Clear Analytics is a business intelligence solution that enables non technical end users to perform analytics by leveraging existing knowledge of Excel coupled with a built in query builder. Some key features include: Dynamic Data Refresh, Data Share and In-Excel Collaboration.
$29
Per Seat per Month
Google Charts
Score 8.2 out of 10
N/A
Google Charts provides a way to visualize data on your website - for free. From simple line charts to complex hierarchical tree maps, the chart gallery provides a large number of ready-to-use chart types. The most common way to use Google Charts is with simple JavaScript that you embed in your web page.N/A
Pricing
Clear AnalyticsGoogle Charts
Editions & Modules
Personal
$29
Per Seat per Month
Team
$165
upto 10 Seat per Month
Department
$265
upto 25 Seat per month
Organization
$565
Upto 100 per seat per month
No answers on this topic
Offerings
Pricing Offerings
Clear AnalyticsGoogle Charts
Free Trial
YesNo
Free/Freemium Version
NoYes
Premium Consulting/Integration Services
NoNo
Entry-level Setup Fee$800 Initial OnBoardingNo setup fee
Additional DetailsCertain Enterprise level features can be made available to Small Business edition at additional cost. Such services include Scheduler and OLAP connectivity. Custom adapters can also be created to connect to SaaS services.
More Pricing Information
Community Pulse
Clear AnalyticsGoogle Charts
Considered Both Products
Clear Analytics
Chose Clear Analytics
I personally have not used other tools like this but Clear Analytics is a great one.
Chose Clear Analytics
Tableau something we use in previous with other clients. Heavy tool to use and customization is bit challenging. Also it's setup is bit complex when compare to Clear Analytics
Chose Clear Analytics
Clear Analytics provides a better organization of data that it gathers from different sources that can be utilized for various reporting purposes. Clear Analytics has better integration with different internal ERPs and needs lesser customization as such. Overall it's one of the …
Chose Clear Analytics
There are other great tools that are out there but Clear Analytics is reasonable for our business and provides a lot of features that we specifically needed.
Chose Clear Analytics
We didn’t choose this software because we found it didn’t adjust to what we really needed to do as a small business.
Google Charts
Chose Google Charts
In comparison to Microsoft Power BI, Google Charts has more ease of use for businesses who simply need a way to visually display their data from their reports. Although Power BI may be more robust in more complicated data compilation, Google Charts can still be able to do some …
Chose Google Charts
As our company heavily utilizes Google products, when we first looked into the tool to help us to present our data, we were looking if we could find anything that is from Google and can satisfy our basic needs. Google Charts fit in it very well. That does not mean we are not …
Chose Google Charts
Google Charts is free so it was a no brainer for our company to use. There may be other products out there that have more functionality or are easy, but they are not free.
Chose Google Charts
Google Charts is great because it is free. There are not really other options that are out there that offer as much as Google Charts does without the cost, so no other software really stacks up.
Chose Google Charts
I also would like to add Chart.js to the list, although it was not a searchable option. Google Charts is hard to beat, considering how effective it is, and that there's no need for an enterprise subscription. It's got basically any sort of chart or timeline or trend tracker you …
Chose Google Charts
Having used other powerful BI tools, Google is still not upto the mark. But it does a decent job for a free tool.
Chose Google Charts
We have not really tried any other software for this purpose other than Google Charts because it is free and has worked very well for us.
Chose Google Charts
It is a reliable tool and its free version definitely stacks up against a lot of other paid versions of other software. So if you are using anything else, it is definitely worth checking out Google Charts.
Chose Google Charts
Google Charts is one of the better software for data visualization because it is free. You can’t beat that!
Chose Google Charts
Google Charts is better than any other alternative because it is free. It is a bit difficult to customize, so there may be better softwares out there depending on the complexity of what you are trying to do.
Chose Google Charts
Google Charts is one of the best tools out there because it integrates perfectly with Google Drive and Google Sheets, etc.
Chose Google Charts
Google Charts does offer a lot of functionality and it is also free which is why it is a great choice for our team. We are always looking for free solutions that are out there.
Chose Google Charts
Smartsheet integrates better with JIRA out of the box so we primarily use Smartsheet for visualisation of our Sprint breakdown. However, when reporting to higher-ups, we use Google Charts as the flexibility is far greater. We can better make visualisations that suite our …
Chose Google Charts
There are very many other softwares out there that are as intuitive as Google Charts and that is what makes it great.
Chose Google Charts
Our teams were already using Google's G suite and as google charts simply came tagged along with it, they were more than happy to go with google charts given its capabilities. Though we have another BI solution in place but teams mostly work with google charts and export their …
Chose Google Charts
Google Charts stacks up better since it is free and does not have the constant pressure for cost overruns, add-ons, annual maintenance and implementation services. The speed of using Google Charts is quick, saving users potentially weeks in getting up and going. For the …
Chose Google Charts
Chart.js is another javascript alternative to Google Charts. It outputs charts in Canvas elements rather than SVG, so it's a bit easier to manipulate and make responsive.
Chose Google Charts
For both the tools you need a good programming knowledge but this is not the case with Google Charts.
Chose Google Charts
I honestly have no used others. This was my first in my field. But I can say it's been a joy to work with and I don't see myself or my organization using any other platform or program.
Chose Google Charts
Went with Google Charts directly. Integrates with other Google apps that we use seamlessly.
Chose Google Charts
We selected Google Charts because it is a free tool and is a part of the GSuite.
Chose Google Charts
We have not really used any other products, but we do not really need a reason to because this one has worked so well for us.
Chose Google Charts
I've used D3.js and Google Charts, in my opinion, is easier to use and more accessible. But D3.js is much more visually flexible and has a lot of different use cases if we compare it to this service. So I think Google Charts is suitable for dashboards and applications that …
Chose Google Charts
I have not used many other software similar to Google Charts because a lot of the software I have used in the past has integrated reporting available to the customer. However, for instances where our software reporting is not accurate, we are able to use this online source to …
Chose Google Charts
I definitely prefer Google Charts over Piktochart chart because of the way that it integrates with Google Sheets, Google Drive, and Google Docs. The entire G Suite is completely crucial to our operation and having an outside chart program doesn't streamline or make data …
Features
Clear AnalyticsGoogle Charts
BI Standard Reporting
Comparison of BI Standard Reporting features of Product A and Product B
Clear Analytics
9.0
Ratings
10% above category average
Google Charts
8.6
Ratings
5% above category average
Pixel Perfect reports9.00 Ratings8.10 Ratings
Customizable dashboards9.10 Ratings9.00 Ratings
Report Formatting Templates8.70 Ratings8.80 Ratings
Ad-hoc Reporting
Comparison of Ad-hoc Reporting features of Product A and Product B
Clear Analytics
8.9
Ratings
10% above category average
Google Charts
9.3
Ratings
15% above category average
Drill-down analysis9.20 Ratings8.00 Ratings
Formatting capabilities8.70 Ratings10.00 Ratings
Report sharing and collaboration8.90 Ratings9.60 Ratings
Integration with R or other statistical packages00 Ratings9.50 Ratings
Report Output and Scheduling
Comparison of Report Output and Scheduling features of Product A and Product B
Clear Analytics
9.0
Ratings
10% above category average
Google Charts
9.0
Ratings
10% above category average
Publish to Web9.00 Ratings9.60 Ratings
Publish to PDF9.10 Ratings9.60 Ratings
Report Versioning8.90 Ratings8.60 Ratings
Report Delivery Scheduling8.80 Ratings8.70 Ratings
Delivery to Remote Servers00 Ratings8.80 Ratings
Data Discovery and Visualization
Comparison of Data Discovery and Visualization features of Product A and Product B
Clear Analytics
9.0
Ratings
12% above category average
Google Charts
7.7
Ratings
4% below category average
Pre-built visualization formats (heatmaps, scatter plots etc.)8.90 Ratings8.00 Ratings
Location Analytics / Geographic Visualization9.10 Ratings6.00 Ratings
Predictive Analytics00 Ratings9.00 Ratings
Access Control and Security
Comparison of Access Control and Security features of Product A and Product B
Clear Analytics
9.3
Ratings
9% above category average
Google Charts
8.8
Ratings
4% above category average
Multi-User Support (named login)9.40 Ratings8.90 Ratings
Role-Based Security Model9.00 Ratings8.80 Ratings
Multiple Access Permission Levels (Create, Read, Delete)9.40 Ratings8.80 Ratings
Single Sign-On (SSO)00 Ratings8.80 Ratings
Mobile Capabilities
Comparison of Mobile Capabilities features of Product A and Product B
Clear Analytics
8.6
Ratings
11% above category average
Google Charts
8.2
Ratings
7% above category average
Mobile Application8.50 Ratings9.60 Ratings
Dashboard / Report / Visualization Interactivity on Mobile8.70 Ratings8.00 Ratings
Responsive Design for Web Access00 Ratings7.00 Ratings
Application Program Interfaces (APIs) / Embedding
Comparison of Application Program Interfaces (APIs) / Embedding features of Product A and Product B
Clear Analytics
-
Ratings
Google Charts
8.4
Ratings
8% above category average
REST API00 Ratings8.90 Ratings
Javascript API00 Ratings10.00 Ratings
iFrames00 Ratings8.80 Ratings
Java API00 Ratings8.90 Ratings
Themeable User Interface (UI)00 Ratings5.00 Ratings
Customizable Platform (Open Source)00 Ratings8.80 Ratings
Best Alternatives
Clear AnalyticsGoogle Charts
Small Businesses
Yellowfin
Yellowfin
Score 8.6 out of 10
Yellowfin
Yellowfin
Score 8.6 out of 10
Medium-sized Companies
Reveal
Reveal
Score 10.0 out of 10
Reveal
Reveal
Score 10.0 out of 10
Enterprises
Kyvos Semantic Layer
Score 9.5 out of 10
Kyvos Semantic Layer
Score 9.5 out of 10
All AlternativesView all alternativesView all alternatives
User Ratings
Clear AnalyticsGoogle Charts
Likelihood to Recommend
9.0
(0 ratings)
9.0
(0 ratings)
Likelihood to Renew
-
(0 ratings)
7.3
(0 ratings)
Usability
9.1
(0 ratings)
9.0
(0 ratings)
Availability
-
(0 ratings)
10.0
(0 ratings)
Performance
-
(0 ratings)
5.0
(0 ratings)
Support Rating
9.5
(0 ratings)
8.3
(0 ratings)
Online Training
-
(0 ratings)
5.0
(0 ratings)
Implementation Rating
-
(0 ratings)
10.0
(0 ratings)
Configurability
-
(0 ratings)
8.0
(0 ratings)
Ease of integration
-
(0 ratings)
10.0
(0 ratings)
Product Scalability
-
(0 ratings)
8.0
(0 ratings)
Vendor post-sale
-
(0 ratings)
10.0
(0 ratings)
Vendor pre-sale
-
(0 ratings)
10.0
(0 ratings)
User Testimonials
Clear AnalyticsGoogle Charts
Likelihood to Recommend
Clear Analytics has almost all the features which are mostly required by the organizations for their data analytics and transformation activities. Clear Analytics is built on the support of a parallel query engine which makes it handle large volume requests and also provides optimized results. However, every solution has some limitations, Clear Analytics lacks advanced features such as Predictive Analytics which is a very demanding feature in the market as most organizations are adopting AI/ML automation for their businesses. Also, it needs to add a lot of advanced visualizations so that the user has the choice of selection. Overall a good solution to be recommended.
Read full review
Google Charts is perfectly suited for most presentations that are data oriented. There's not much of a limit on the type of table or chart you can create, and being able to integrate with Google Sheets just makes things even easier if you've already got the data stored somewhere. It works well on desktop browsers, Iphones, and Android phones. The only drawback I've been able to find is for those that prefer to have a desktop application.
Read full review
Pros
  • Integrates directly with Power BI and Excel
  • Helps wrangle, filter and visualize data
  • Presentation of large data in a summarized manner
Read full review
  • Google Charts is free so a terrific tool for universities and students
  • Provides new users that need charts an inventory and gallery of potential charts and types to visualize data
  • The software is useful to add charts and data for websites with limited effort but with success
Read full review
Cons
  • For Charts and Graphs , getting the Power Point Deck would be helpful. As of now we use the data from Excel Reports
Read full review
  • I would like a couple more introductory videos or a live chat option for when you run into an issue. I think this is a Google-wide problem, not only linked to Google Charts.
  • I have run into some issues with the Dynamic Data but also admittedly could potentially dive in deeper and investigate.
  • It would be great if Google Charts made it possible to integrate Google Chat into the platform.
Read full review
Likelihood to Renew
No answers on this topic
Google Charts is a good product. It's widely supported with deep documentation and a large community. But for me, it wasn't customizable enough. When we started with simple charts, it was great, but as we got deeper and more complex, our needs outgrew the library. If I was going forward, I would choose a more barebones library with more freedom and extensibility.
Read full review
Usability
I have really enjoyed working with Clear Analytics. This platform has contributed to increased production and reliable data control processes. It has flexible user interface that can be operated by any organization member. Reports are shared on simple and transparent way in the dashboard for easy access. Data analytics from all departments have created manageable working environment that have increased production.
Read full review
Requires knowledge of Javascript, which can be difficult for a beginner. A business analyst often isn't as technically minded as a developer so collaboration is often required to produce a correct chart for the purpose required. However, the customisation capable due to this creates much better looking charts compared to other tools.
Read full review
Reliability and Availability
No answers on this topic
Google charts is always available and provides fast output.
Read full review
Performance
No answers on this topic
Connectivity is occasionally very slow.
Read full review
Support Rating
Clear Analytics has very good team members in Consulting as well as in Customer Support. The support agents are capable of providing the required resolution of your queries in a timeline provides. They have a clear understanding of the product and its features, and they are friendly in nature. However, for some advanced or level 2/3-based queries, they required some more time to respond, which is ok.
Read full review
Google Charts has a very good documentation that we can just go in there and find the stuff we need to implement our solutions on Google Charts. Plus, if we get stuck, we can also email the support and they are very responsive. So overall, the support is very satisfying.
Read full review
Online Training
No answers on this topic
The online training was solely done through self training on google's guide to charts.
Read full review
Implementation Rating
No answers on this topic
Easy to implement
Read full review
Alternatives Considered
We didn’t choose this software because we found it didn’t adjust to what we really needed to do as a small business.
Read full review
In comparison to Microsoft Power BI, Google Charts has more ease of use for businesses who simply need a way to visually display their data from their reports. Although Power BI may be more robust in more complicated data compilation, Google Charts can still be able to do some of the basics that Power BI delivers.
Read full review
Scalability
No answers on this topic
Google Charts is essential for quick, easy, reporting. There are opportunities for advanced features.
Read full review
Return on Investment
  • Super useful to get started immediately
  • Didn't have to rely on migrating data
  • Easy to add members
  • Easy to learn and build charts
Read full review
  • teams were easily able to create charts and find out progress on our learning courses and thus take actionable insights to their managers, professors
  • students could also know their progress on various courses from one single view, same for instructors in terms of imparting education
  • sales team could learn which kind of courses sold more to focus more on those areas
Read full review
ScreenShots

Clear Analytics Screenshots

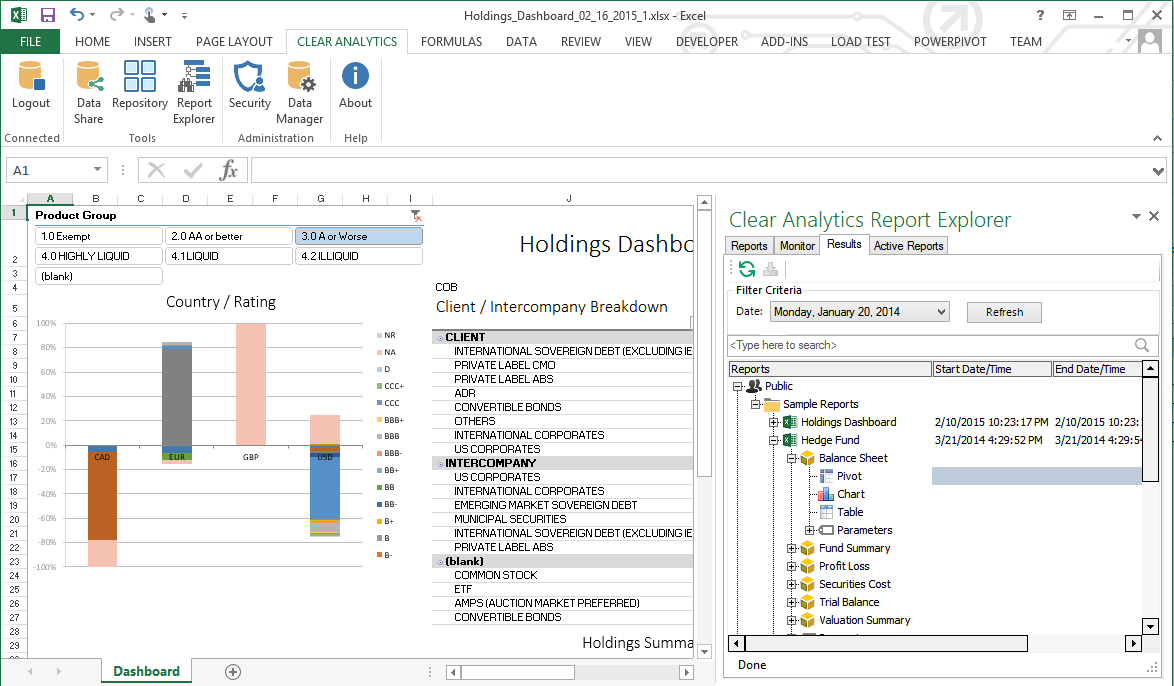
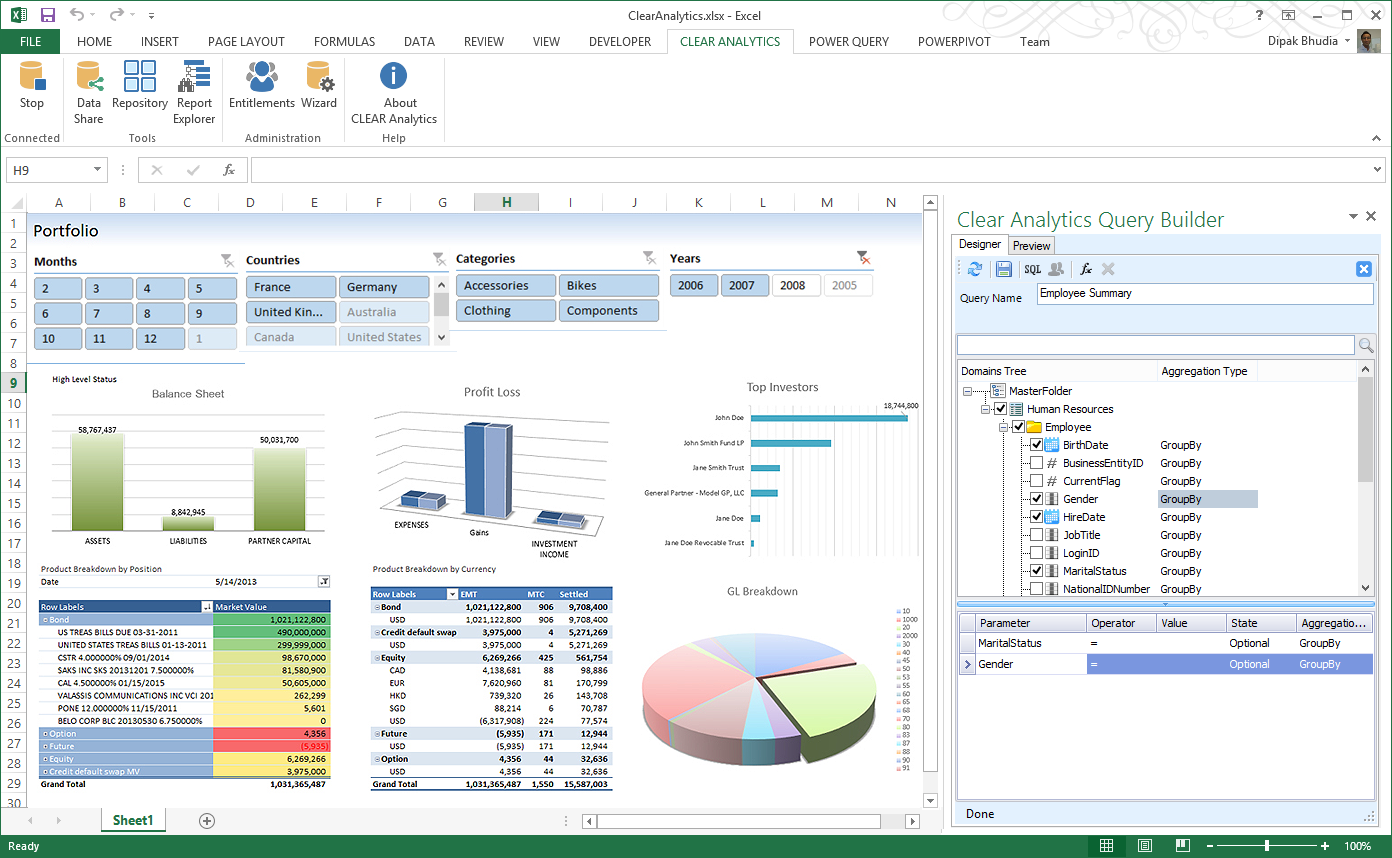
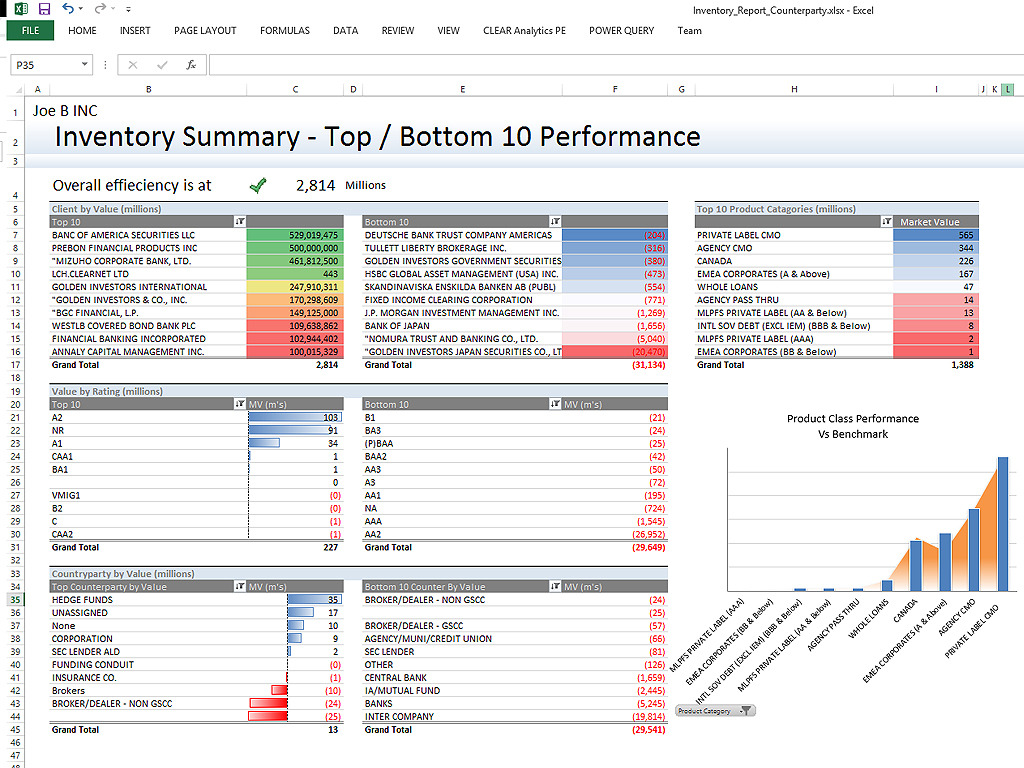
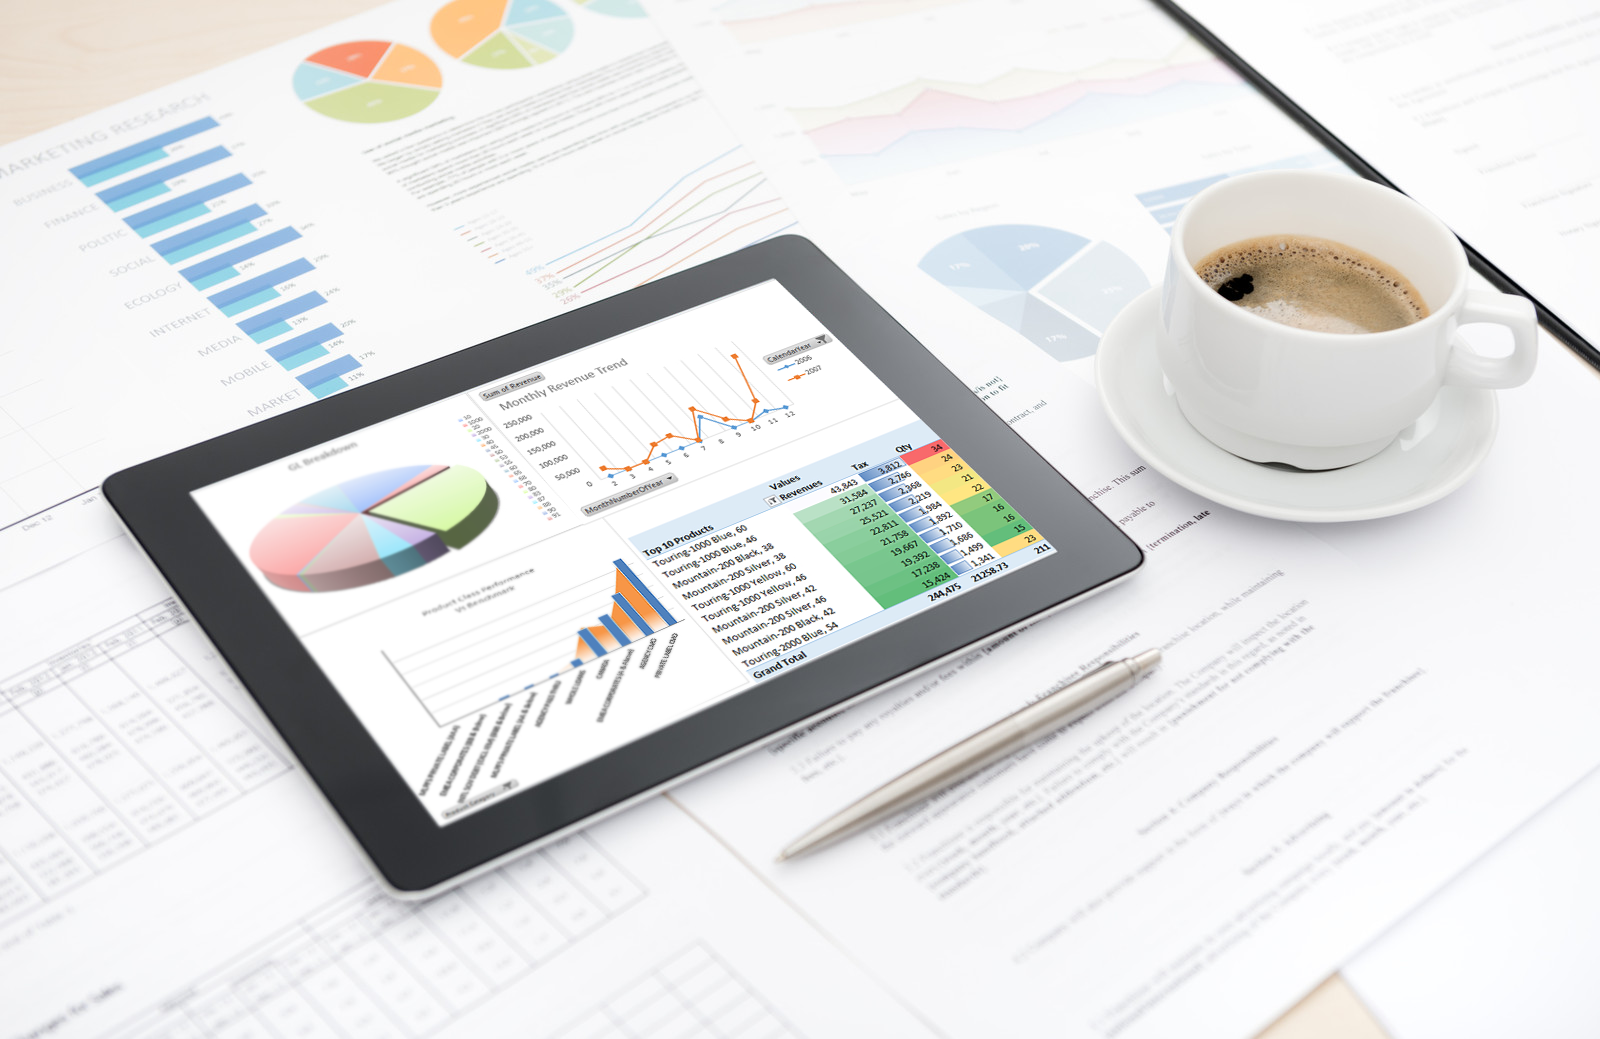
Screenshot of Clear Analytics integrated Excel panel essentially transforms standalone Excel into an enterprise strength, fully auditable, collaborative and centralized business intelligence platform.Screenshot of Users have the ability to dynamically query systems and render that data in any way they like.  No more waiting on IT to create reports.Screenshot of Your firms existing knowledge of Excel enables the firm to be product from day 1. Use the skills already present in your organization and don't pay for outside reporting consultants to create reports for you.Screenshot of Leverage the integration capability of Microsoft's Power BI to extend the reach of your data to web and mobile devices.Screenshot of Leverage all of Excels capabilities, from it's slicers to miniature spark-line charts to create incredibly informative and responsive dashboards.