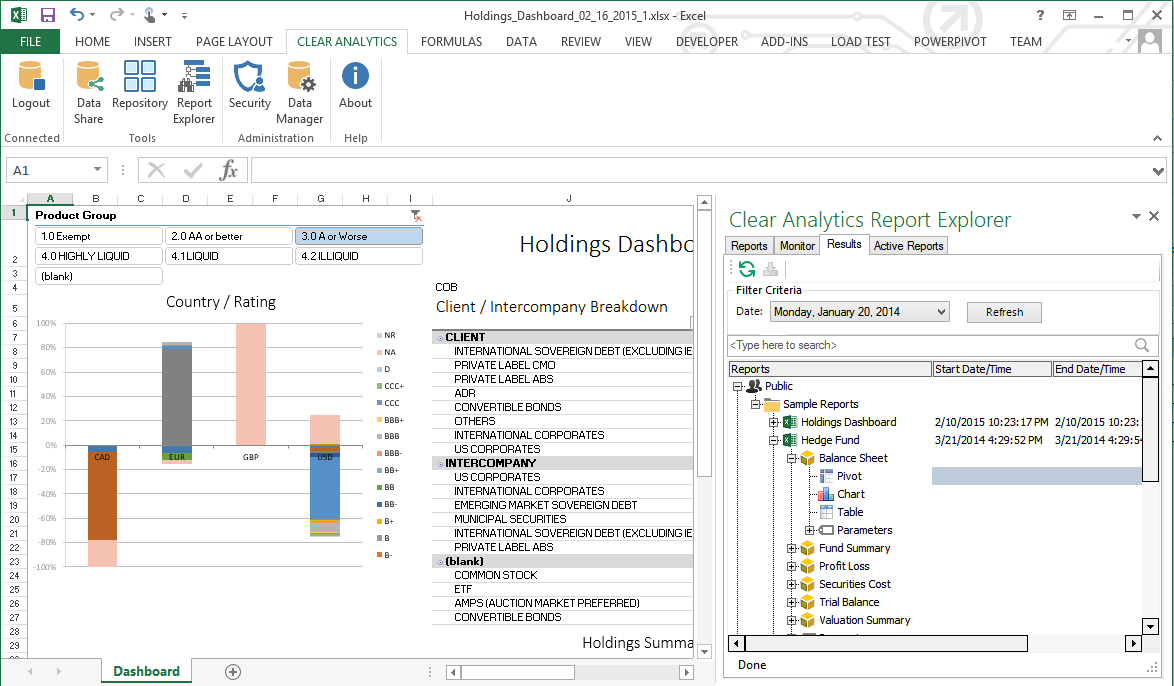
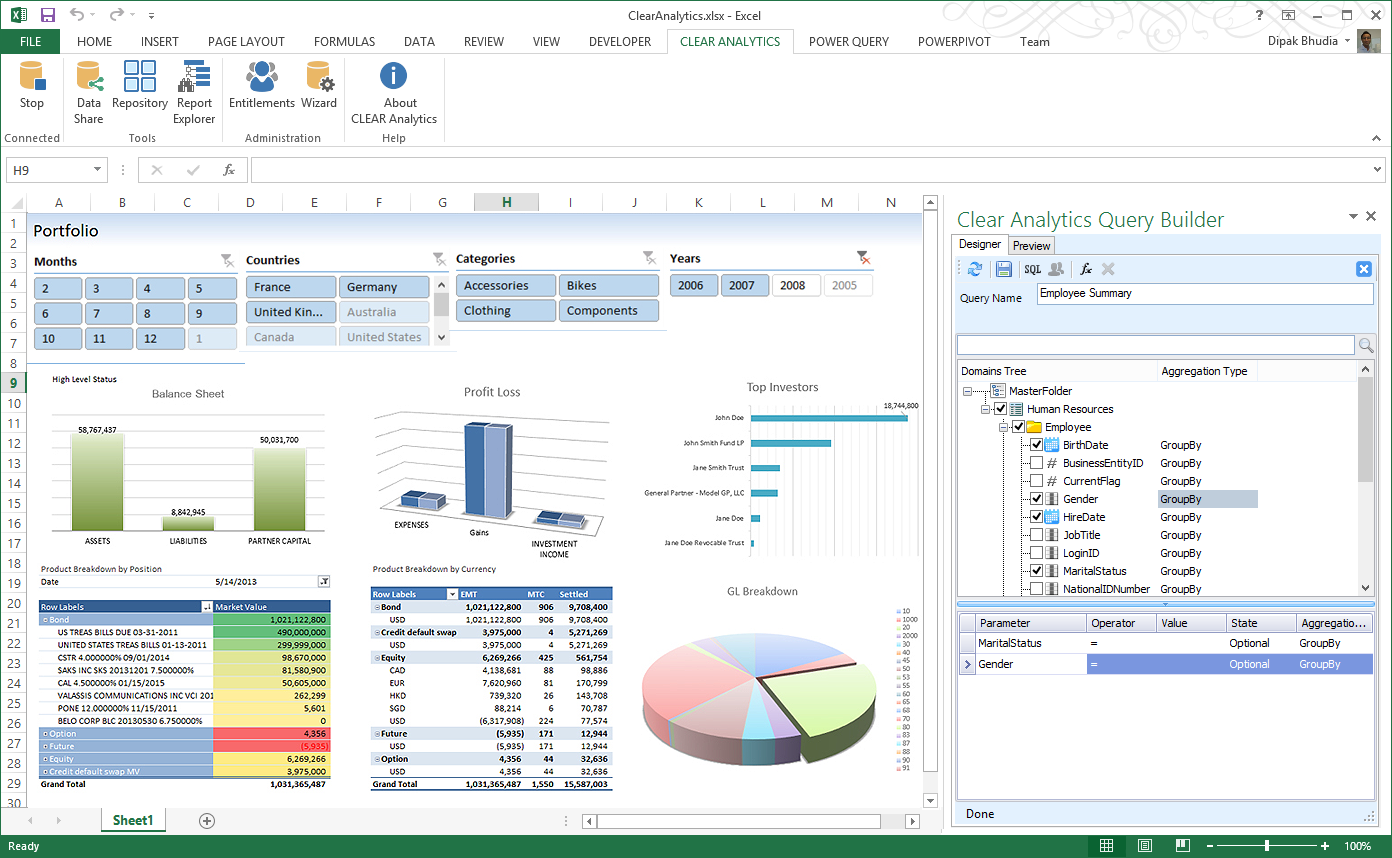
Clear Analytics is a business intelligence solution that enables non technical end users to perform analytics by leveraging existing knowledge of Excel coupled with a built in query builder. Some key features include: Dynamic Data Refresh, Data Share and In-Excel Collaboration.
$29
Per Seat per Month
Zendesk Explore
Score 8.3 out of 10
N/A
Zendesk offers Explore, a business intelligence and customer analytics tool which integrates with the Zendesk suite featuring ticket analytics, custom fields, dashboards, and other features. Zendesk is migrating customers of the BIME analytics product, which is approaching end of support, to Zendesk Explore in 2019.
N/A
Pricing
Clear Analytics
Zendesk Explore
Editions & Modules
Personal
$29
Per Seat per Month
Team
$165
upto 10 Seat per Month
Department
$265
upto 25 Seat per month
Organization
$565
Upto 100 per seat per month
No answers on this topic
Offerings
Pricing Offerings
Clear Analytics
Zendesk Explore
Free Trial
Yes
No
Free/Freemium Version
No
No
Premium Consulting/Integration Services
Yes
No
Entry-level Setup Fee
$800 Initial OnBoarding
No setup fee
Additional Details
Certain Enterprise level features can be made available to Small Business edition at additional cost. Such services include Scheduler and OLAP connectivity.
Custom adapters can also be created to connect to SaaS services.
—
More Pricing Information
Community Pulse
Clear Analytics
Zendesk Explore
Features
Clear Analytics
Zendesk Explore
BI Standard Reporting
Comparison of BI Standard Reporting features of Product A and Product B
Clear Analytics
9.0
8 Ratings
9% above category average
Zendesk Explore
9.0
10 Ratings
9% above category average
Pixel Perfect reports
9.08 Ratings
7.96 Ratings
Customizable dashboards
9.18 Ratings
9.110 Ratings
Report Formatting Templates
8.78 Ratings
9.97 Ratings
Ad-hoc Reporting
Comparison of Ad-hoc Reporting features of Product A and Product B
Clear Analytics
8.9
8 Ratings
10% above category average
Zendesk Explore
6.8
10 Ratings
16% below category average
Drill-down analysis
9.28 Ratings
10.010 Ratings
Formatting capabilities
8.78 Ratings
5.310 Ratings
Report sharing and collaboration
8.98 Ratings
7.210 Ratings
Integration with R or other statistical packages
00 Ratings
4.85 Ratings
Report Output and Scheduling
Comparison of Report Output and Scheduling features of Product A and Product B
Clear Analytics
9.0
8 Ratings
9% above category average
Zendesk Explore
7.8
10 Ratings
5% below category average
Publish to Web
9.08 Ratings
6.96 Ratings
Publish to PDF
9.17 Ratings
6.18 Ratings
Report Versioning
8.98 Ratings
9.03 Ratings
Report Delivery Scheduling
8.87 Ratings
8.97 Ratings
Delivery to Remote Servers
00 Ratings
8.14 Ratings
Data Discovery and Visualization
Comparison of Data Discovery and Visualization features of Product A and Product B
Clear Analytics has almost all the features which are mostly required by the organizations for their data analytics and transformation activities. Clear Analytics is built on the support of a parallel query engine which makes it handle large volume requests and also provides optimized results. However, every solution has some limitations, Clear Analytics lacks advanced features such as Predictive Analytics which is a very demanding feature in the market as most organizations are adopting AI/ML automation for their businesses. Also, it needs to add a lot of advanced visualizations so that the user has the choice of selection. Overall a good solution to be recommended.
Zendesk Explore is well suited for tracking ticket flow, agent performance, and customer satisfaction providing valuable insights into response and resolution time, workload and support quality. Particularly useful for monitoring ticket handling for different teams. Helps ensure accountability by tracking how long tickets remain assigned before being reassigned to another group. Drill down capability helps identify support bottlenecks. However, it is less appropriate for real time monitoring as it lacks real time data updates making it unsuitable for instant decision making.
Some aspects of Zendesk, in general, are not super intuitive. The same goes for Zendesk Explore. And, while you can google answers and hope you find something helpful, there isn't a great way to learn to get the full potential out of the product unless you want to pay for someone from your team to take a class (which costs several hundred dollars).
To piggyback off the last point, if you would prefer to get help from a Zendesk expert, you'll find that there is almost no customer support available to you. For a company that aims to help other companies help their customers, this has always struck me as odd. Again, Google is your friend and beyond that, you're mostly out of luck.
I have really enjoyed working with Clear Analytics. This platform has contributed to increased production and reliable data control processes. It has flexible user interface that can be operated by any organization member. Reports are shared on simple and transparent way in the dashboard for easy access. Data analytics from all departments have created manageable working environment that have increased production.
I rate Zendesk Explore 8 out of 10 for it's overall usability because it offers powerful reporting and analytics with an easy to navigate interface and intuitive dashboards. It helps improve customer satisfaction by providing valuable insights into ticket handling, agent performance and customer satisfaction. Though the complex query builder can be challenging for non technical users.
I have had multiple scenarios where I had to reach out to the support team of Clear Analytics, be it access-related, general queries, during initial implementation, etc. My overall experience has always been good. I got the needed support every time without any delay. I can definitely recommend Clear Analytics simply on the basis of its excellent support team.
Support for all of Zendesk has exceeding my expectations. This company will always get a 10 out of 10 in my book. Any question you have they make sure you have the answer plus a step-by-step guide on how to do each step so you are set up for success!
There are other great tools that are out there but Clear Analytics is reasonable for our business and provides a lot of features that we specifically needed
I selected Zendesk Explore only to provide an easy and quick access for my managers and supervisors regading metrics and volume trends. Is not the most flexible nor complete data visualization tool, but works well for day-to-day follow ups. You need to use another tool if you want to see long-term patterns (e.g. month over month volume trends) and you need another platform if you want your interaction metrics to interact with other important factors of the business