ComponentOne vs. Flexmonster Pivot Table & Charts Component vs. Ignite UI
ComponentOne vs. Flexmonster Pivot Table & Charts Component vs. Ignite UI
| Product | Rating | Most Used By | Product Summary | Starting Price |
|---|---|---|---|---|
 ComponentOne | N/A | ComponentOne Studio, from software company GrapeCity in Pittsburgh, Pennsylvania, provides Visual Studio controls. | $1,299 per year per developer | |
 Flexmonster Pivot Table & Charts Component | Mid-Size Companies (51-1,000 employees) | Flexmonster Pivot Table & Charts is a component for interactive pivot reports that can be inserted into a web page or a web application. It’s a JavaScript tool that enables a user to visualize their business data. This solution supports Microsoft Analysis Services OLAP cubes, Mondrian, icCube, JSON, SQL (MS SQL, MySQL and others) databases or static JSON or CSV files. According to the vendor, this solution allows users to work extremely quickly with really large data… | $0 Annual SaaS Subscription | |
 Ignite UI | N/A | New Jersey based Infragistics offers .NET controls. | $1,295 per year per user |
| ComponentOne | Flexmonster Pivot Table & Charts Component | Ignite UI | ||||||||||||||||||||||
|---|---|---|---|---|---|---|---|---|---|---|---|---|---|---|---|---|---|---|---|---|---|---|---|---|
| Editions & Modules |
|
| No answers on this topic | |||||||||||||||||||||
| Offerings |
| |||||||||||||||||||||||
| Entry-level Setup Fee | No setup fee | No setup fee | No setup fee | |||||||||||||||||||||
| Additional Details | — | — | — | |||||||||||||||||||||
| More Pricing Information | ||||||||||||||||||||||||
| ComponentOne | Flexmonster Pivot Table & Charts Component | Ignite UI |
|---|
| ComponentOne | Flexmonster Pivot Table & Charts Component | Ignite UI | |||||||||||
|---|---|---|---|---|---|---|---|---|---|---|---|---|---|
| BI Standard Reporting |
| ||||||||||||
| Ad-hoc Reporting |
| ||||||||||||
| Report Output and Scheduling |
| ||||||||||||
| Mobile Capabilities |
|
| ComponentOne | Flexmonster Pivot Table & Charts Component | Ignite UI | |
|---|---|---|---|
| Small Businesses |  React (React.js) Score 8.8 out of 10 |  Yellowfin Score 8.7 out of 10 | React (React.js) Score 8.8 out of 10 |
| Medium-sized Companies | React (React.js) Score 8.8 out of 10 |  Reveal Score 10.0 out of 10 | React (React.js) Score 8.8 out of 10 |
| Enterprises | React (React.js) Score 8.8 out of 10 |  Kyvos Semantic Layer Score 9.5 out of 10 | React (React.js) Score 8.8 out of 10 |
| All Alternatives | View all alternatives | View all alternatives | View all alternatives |
| ComponentOne | Flexmonster Pivot Table & Charts Component | Ignite UI | |
|---|---|---|---|
| Likelihood to Recommend | 9.0 (1 ratings) | 10.0 (1 ratings) | 10.0 (1 ratings) |
| Usability | - (0 ratings) | 9.0 (1 ratings) | - (0 ratings) |
| Support Rating | - (0 ratings) | 10.0 (1 ratings) | - (0 ratings) |
| ComponentOne | Flexmonster Pivot Table & Charts Component | Ignite UI | |
|---|---|---|---|
| Likelihood to Recommend |  MESCIUS
 Chris Jensen Senior Developer |  Flexmonster
|  Infragistics
 Robert Burgh President |
| Pros | MESCIUS
Chris Jensen Senior Developer | Flexmonster No answers on this topic | Infragistics
Robert Burgh President |
| Cons | MESCIUS
Chris Jensen Senior Developer | Flexmonster No answers on this topic | Infragistics
Robert Burgh President |
| Usability | MESCIUS No answers on this topic | Flexmonster
| Infragistics No answers on this topic |
| Support Rating | MESCIUS No answers on this topic | Flexmonster
| Infragistics No answers on this topic |
| Alternatives Considered | MESCIUS
Chris Jensen Senior Developer | Flexmonster No answers on this topic | Infragistics
Robert Burgh President |
| Return on Investment | MESCIUS
Chris Jensen Senior Developer | Flexmonster No answers on this topic | Infragistics
Robert Burgh President |
| ScreenShots | Flexmonster Pivot Table & Charts Component Screenshots      | Ignite UI Screenshots 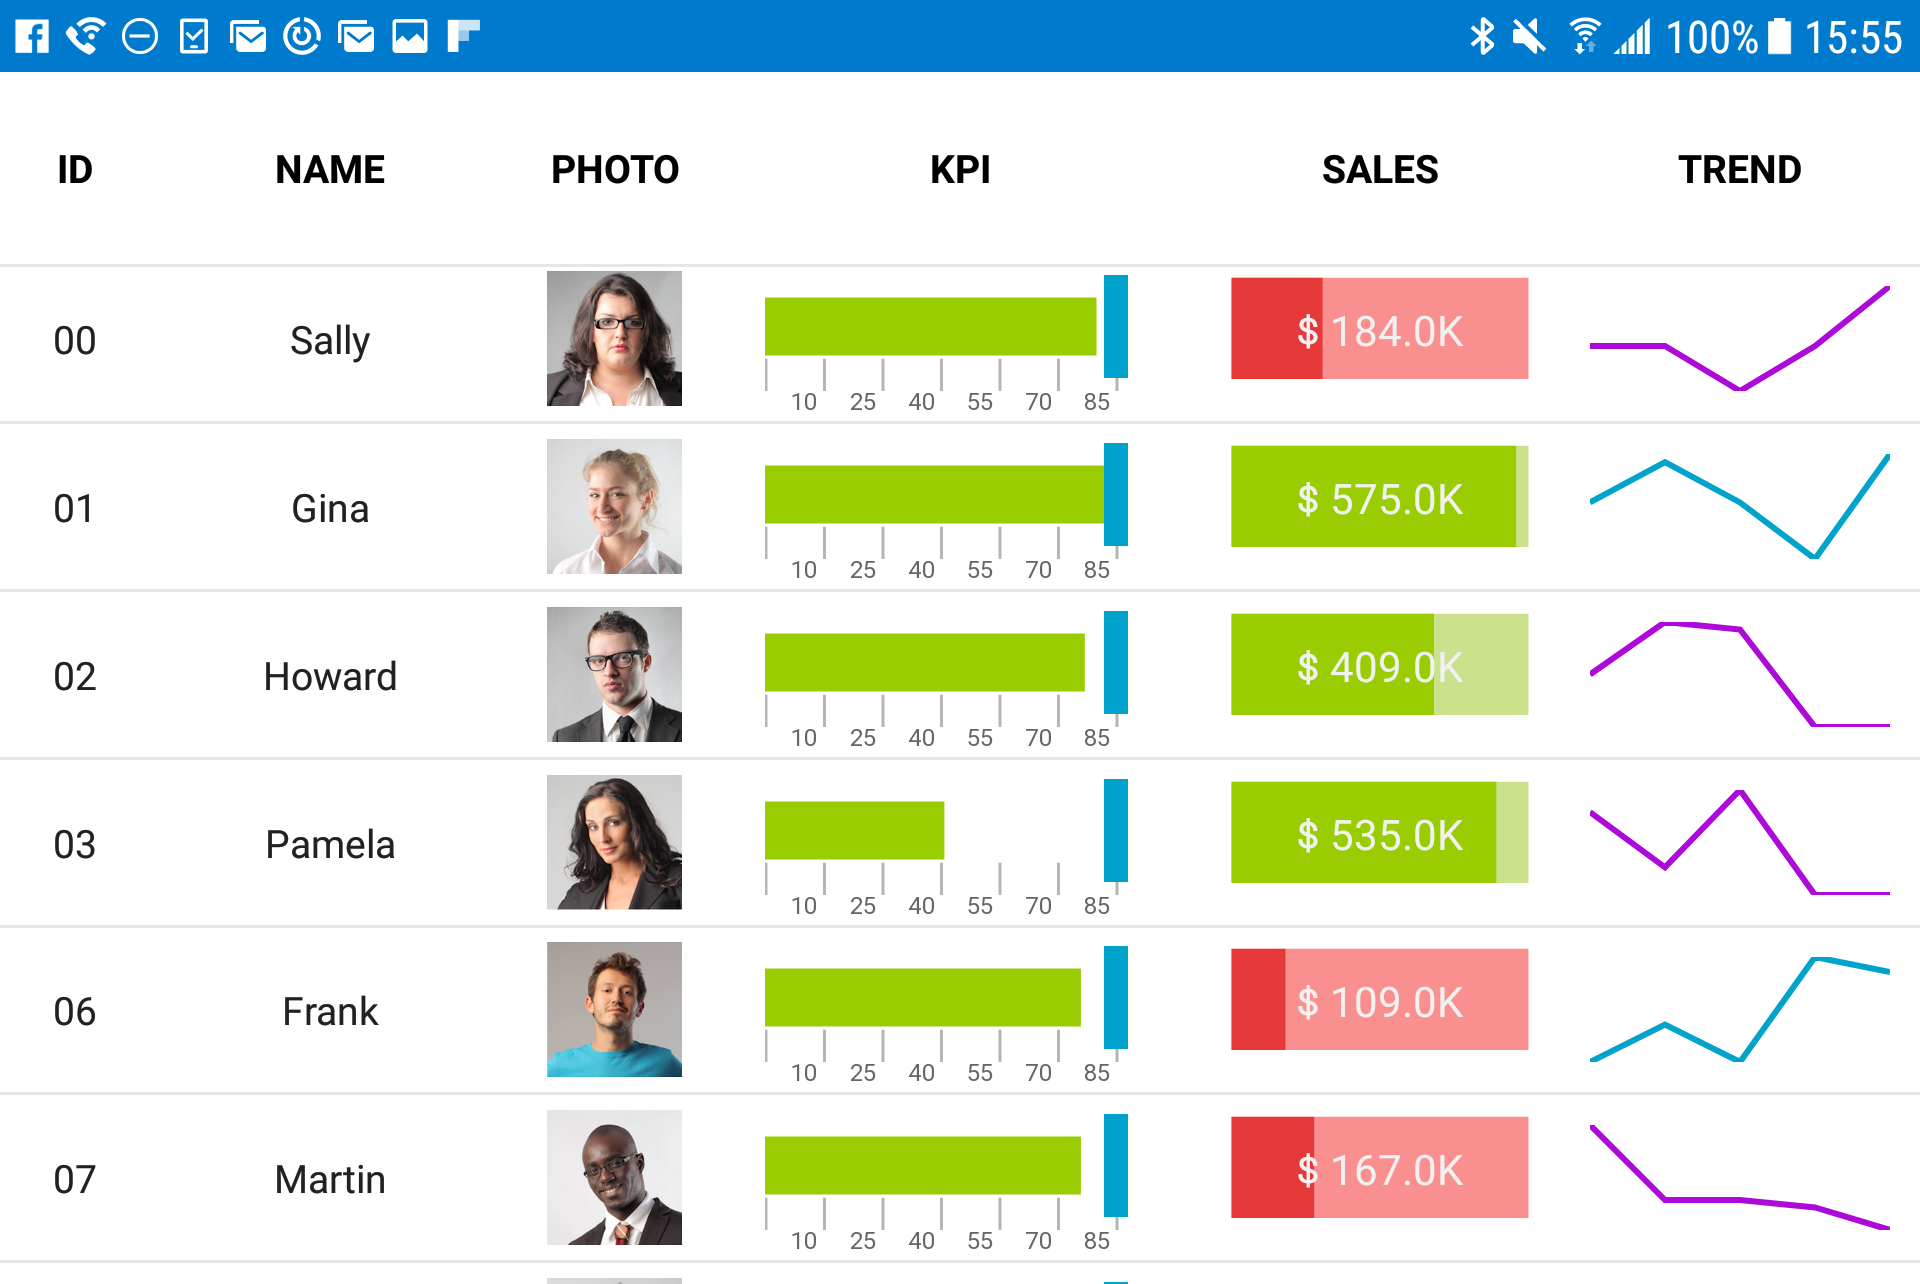 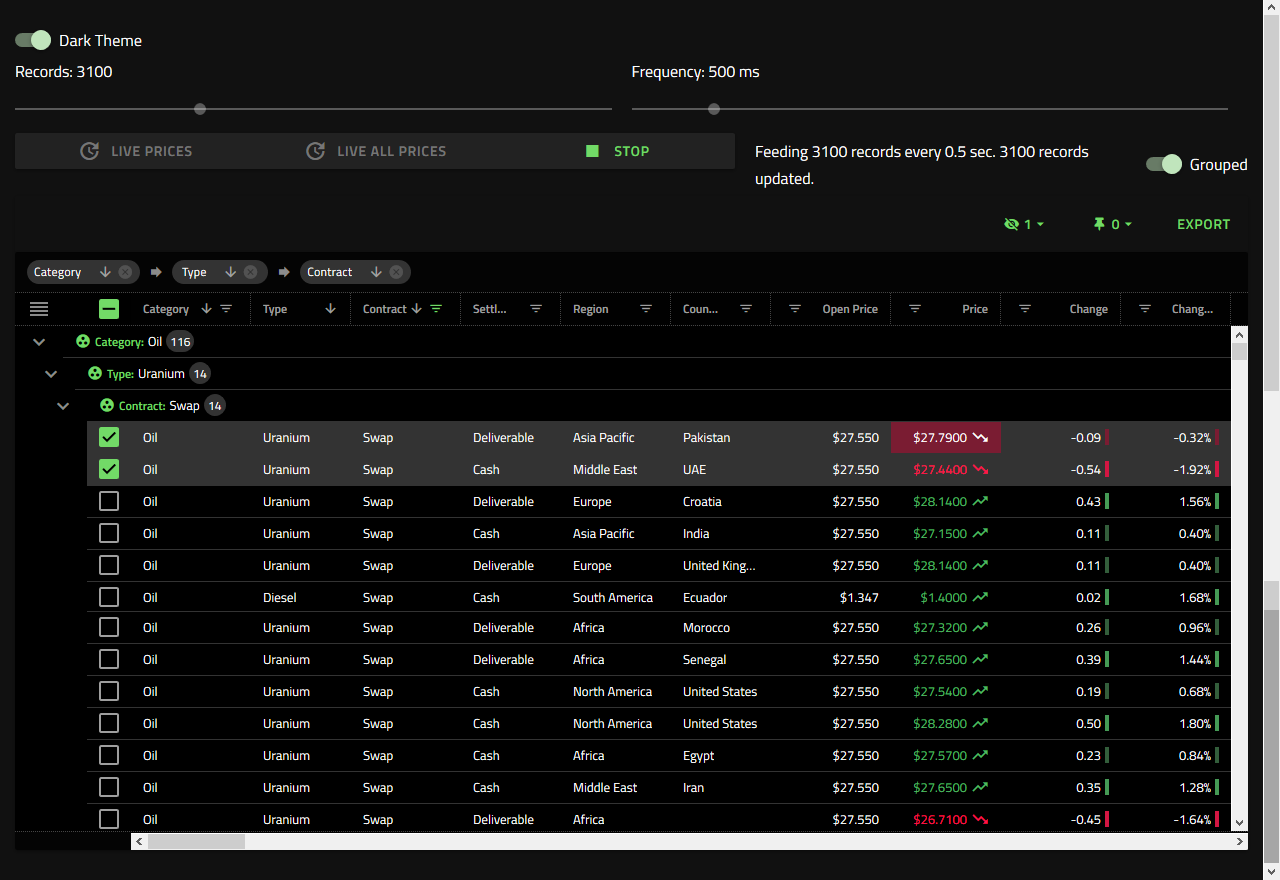 |