D3.js vs. Ignite UI
D3.js vs. Ignite UI
| Product | Rating | Most Used By | Product Summary | Starting Price |
|---|---|---|---|---|
 D3.js | N/A | D3.js is a JavaScript library for manipulating documents based on data. | N/A | |
 Ignite UI | N/A | New Jersey based Infragistics offers .NET controls. | $1,295 per year per user |
| D3.js | Ignite UI | |||||||||||||||
|---|---|---|---|---|---|---|---|---|---|---|---|---|---|---|---|---|
| Editions & Modules | No answers on this topic | No answers on this topic | ||||||||||||||
| Offerings |
| |||||||||||||||
| Entry-level Setup Fee | No setup fee | No setup fee | ||||||||||||||
| Additional Details | — | — | ||||||||||||||
| More Pricing Information | ||||||||||||||||
| D3.js | Ignite UI |
|---|
| D3.js | Ignite UI | |
|---|---|---|
| Small Businesses |  React (React.js) Score 8.9 out of 10 | React (React.js) Score 8.9 out of 10 |
| Medium-sized Companies | React (React.js) Score 8.9 out of 10 | React (React.js) Score 8.9 out of 10 |
| Enterprises | React (React.js) Score 8.9 out of 10 | React (React.js) Score 8.9 out of 10 |
| All Alternatives | View all alternatives | View all alternatives |
| D3.js | Ignite UI | |
|---|---|---|
| Likelihood to Recommend | 8.9 (3 ratings) | 10.0 (1 ratings) |
| Support Rating | 8.0 (1 ratings) | - (0 ratings) |
| D3.js | Ignite UI | |
|---|---|---|
| Likelihood to Recommend |  Open Source
|  Infragistics
 Robert Burgh President |
| Pros | Open Source
 Firaz Peer Fellow | Infragistics
Robert Burgh President |
| Cons | Open Source
 Sanyam Jain Freelancer in RPA | Infragistics
Robert Burgh President |
| Support Rating | Open Source
| Infragistics No answers on this topic |
| Alternatives Considered | Open Source
Firaz Peer Fellow | Infragistics
Robert Burgh President |
| Return on Investment | Open Source
Sanyam Jain Freelancer in RPA | Infragistics
Robert Burgh President |
| ScreenShots | Ignite UI Screenshots 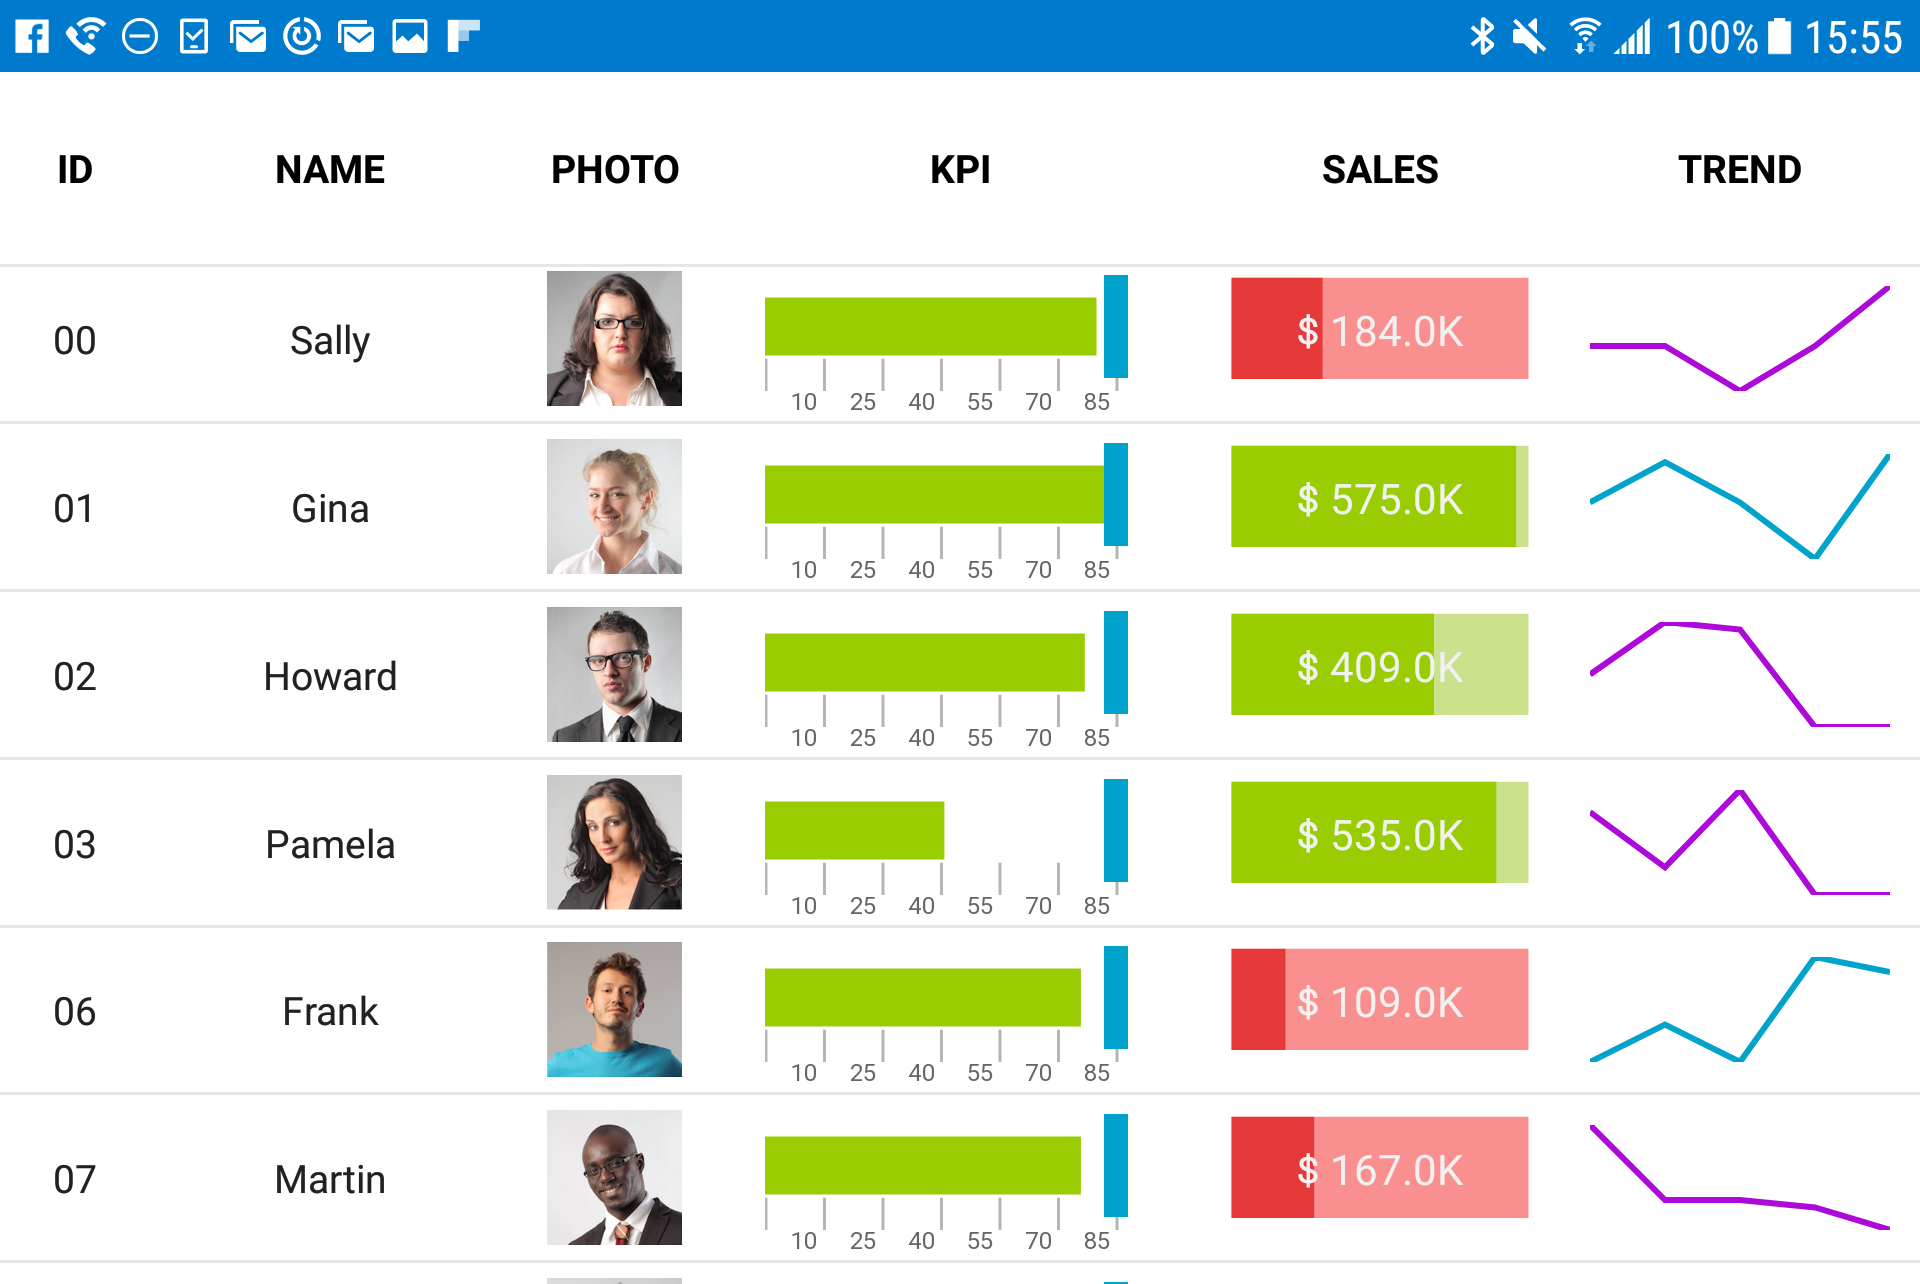 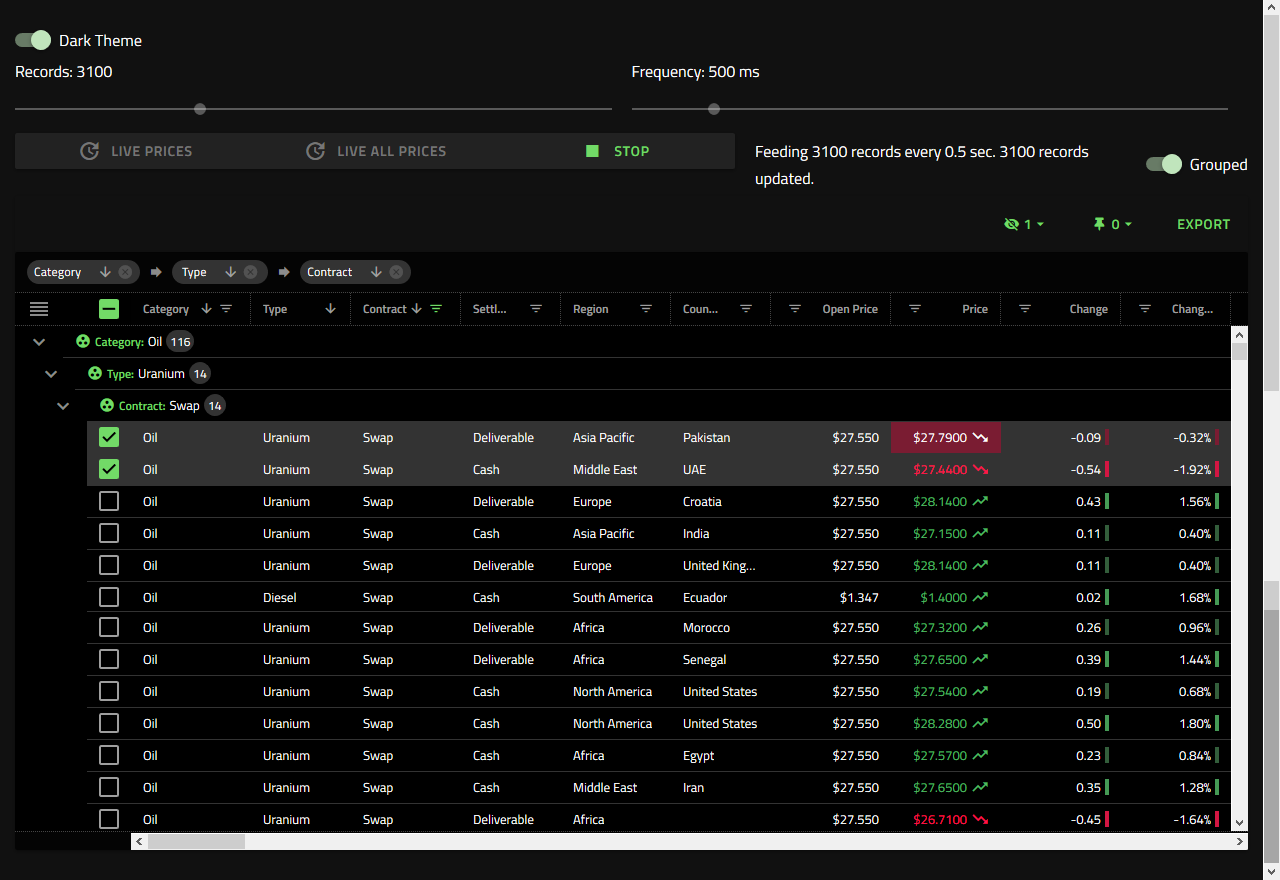 |