Devart Excel Add-ins vs. SAS Visual Analytics
Devart Excel Add-ins vs. SAS Visual Analytics
| Product | Rating | Most Used By | Product Summary | Starting Price |
|---|---|---|---|---|
 Devart Excel Add-ins | N/A | Devart Excel Add-ins allow you to use Excel capabilities to import, process, and analyze data from cloud applications and relational databases. The Excel Add-ins also allow users to make data changes and then save those changes back to the data source they were originally imported from. | $119.95 | |
 SAS Visual Analytics | Enterprise companies (1,001+ employees) | SAS Visual Analytics provides a complete platform for analytics visualization, enabling users to identify patterns and relationships in data that weren't initially evident. Interactive, self-service BI and reporting capabilities are combined with out-of-the-box advanced analytics so everyone can discover insights from any size and type of data, including text. | $0 Annual By Users: 5, 10, 20 |
| Devart Excel Add-ins | SAS Visual Analytics | |||||||||||||||
|---|---|---|---|---|---|---|---|---|---|---|---|---|---|---|---|---|
| Editions & Modules |
|
| ||||||||||||||
| Offerings |
| |||||||||||||||
| Entry-level Setup Fee | No setup fee | No setup fee | ||||||||||||||
| Additional Details | — | SAS Visual Statistics and SAS Office Analytics are also available as add-ons. | ||||||||||||||
| More Pricing Information | ||||||||||||||||
| Devart Excel Add-ins | SAS Visual Analytics | |
|---|---|---|
| Top Pros | ||
| Top Cons |
|
|
| Devart Excel Add-ins | SAS Visual Analytics | |||||||||||||||||||||
|---|---|---|---|---|---|---|---|---|---|---|---|---|---|---|---|---|---|---|---|---|---|---|
| BI Standard Reporting |
| |||||||||||||||||||||
| Ad-hoc Reporting |
| |||||||||||||||||||||
| Report Output and Scheduling |
| |||||||||||||||||||||
| Data Discovery and Visualization |
| |||||||||||||||||||||
| Access Control and Security |
| |||||||||||||||||||||
| Mobile Capabilities |
| |||||||||||||||||||||
| Application Program Interfaces (APIs) / Embedding |
|
| Devart Excel Add-ins | SAS Visual Analytics | |
|---|---|---|
| Small Businesses |  Skyvia Score 9.6 out of 10 |  BrightGauge Score 8.9 out of 10 |
| Medium-sized Companies |  IBM InfoSphere Information Server Score 8.1 out of 10 |  Reveal Score 9.9 out of 10 |
| Enterprises | IBM InfoSphere Information Server Score 8.1 out of 10 |  Jaspersoft Community Edition Score 9.7 out of 10 |
| All Alternatives | View all alternatives | View all alternatives |
| Devart Excel Add-ins | SAS Visual Analytics | |
|---|---|---|
| Likelihood to Recommend | 8.0 (2 ratings) | 9.0 (18 ratings) |
| Likelihood to Renew | - (0 ratings) | 9.3 (3 ratings) |
| Usability | - (0 ratings) | 6.0 (1 ratings) |
| Support Rating | - (0 ratings) | 8.0 (3 ratings) |
| Devart Excel Add-ins | SAS Visual Analytics | |
|---|---|---|
| Likelihood to Recommend |  Devart
 Scott Kennedy Director, eCommerce Analytics and Digital Marketing | SAS
|
| Pros | Devart
| SAS
 Raman Ahuja Associate Consultant |
| Cons | Devart
Scott Kennedy Director, eCommerce Analytics and Digital Marketing | SAS
 Tapan Jain Data Analyst |
| Likelihood to Renew | Devart No answers on this topic | SAS
 Nicole Jagusztyn Institutional Research Officer |
| Usability | Devart No answers on this topic | SAS
Raman Ahuja Associate Consultant |
| Support Rating | Devart No answers on this topic | SAS
Nicole Jagusztyn Institutional Research Officer |
| Alternatives Considered | Devart
| SAS
 Thomas Young Owner, previous CEO |
| Return on Investment | Devart
Scott Kennedy Director, eCommerce Analytics and Digital Marketing | SAS
 suva sahu Project Lead |
| ScreenShots | Devart Excel Add-ins Screenshots  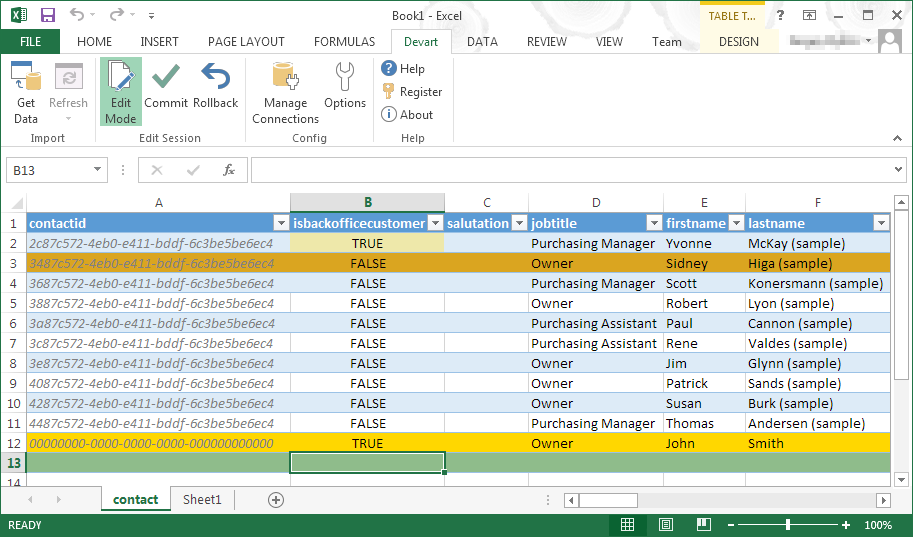 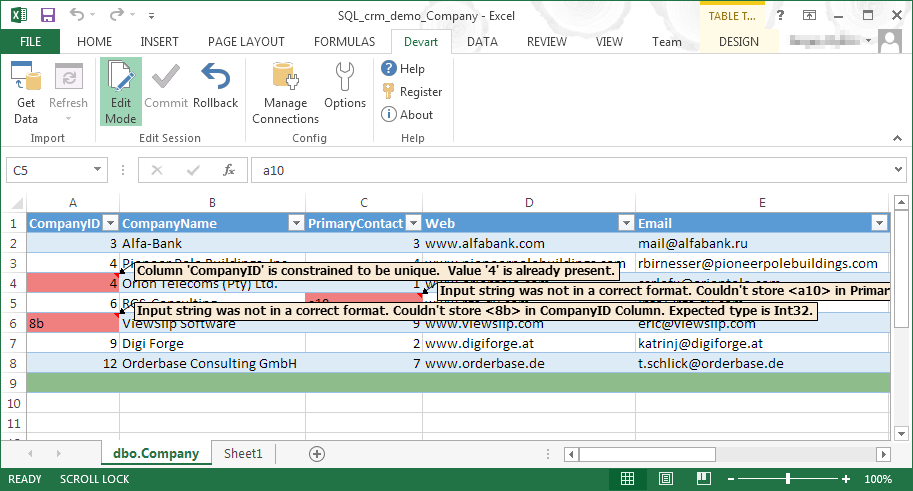 | SAS Visual Analytics Screenshots |