Grow, from Epicor since the March 2022 acquisition, is a business intelligence software that is designed to empower businesses to become data-driven and accelerate growth by aligning team objectives and inspiring strategic decisions.
N/A
JarviX
Score 8.1 out of 10
N/A
Synergies is a cognitive application service provider that combines business knowledge, artificial intelligence technology, and software development. Their mission is to help businesses through their digital transformation journey, become leaders and innovators in their industries by unlocking the power of data in the hands of business users and decision makers. Their product, JarviX, is an AnalyticOps Platform . JarviX uses NLP…
N/A
Pricing
Epicor Grow
JarviX
Editions & Modules
No answers on this topic
No answers on this topic
Offerings
Pricing Offerings
Epicor Grow
JarviX
Free Trial
Yes
No
Free/Freemium Version
No
No
Premium Consulting/Integration Services
Yes
No
Entry-level Setup Fee
Required
No setup fee
Additional Details
—
—
More Pricing Information
Community Pulse
Epicor Grow
JarviX
Features
Epicor Grow
JarviX
BI Standard Reporting
Comparison of BI Standard Reporting features of Product A and Product B
Epicor Grow
8.0
32 Ratings
2% below category average
JarviX
7.6
2 Ratings
8% below category average
Customizable dashboards
9.032 Ratings
7.32 Ratings
Report Formatting Templates
7.025 Ratings
7.31 Ratings
Pixel Perfect reports
00 Ratings
8.21 Ratings
Ad-hoc Reporting
Comparison of Ad-hoc Reporting features of Product A and Product B
Epicor Grow
7.7
31 Ratings
4% below category average
JarviX
7.8
2 Ratings
3% below category average
Drill-down analysis
7.027 Ratings
7.12 Ratings
Formatting capabilities
7.028 Ratings
7.31 Ratings
Report sharing and collaboration
9.030 Ratings
7.72 Ratings
Integration with R or other statistical packages
00 Ratings
9.11 Ratings
Report Output and Scheduling
Comparison of Report Output and Scheduling features of Product A and Product B
Epicor Grow
6.7
29 Ratings
20% below category average
JarviX
7.8
1 Ratings
5% below category average
Publish to Web
7.025 Ratings
9.11 Ratings
Publish to PDF
7.025 Ratings
7.31 Ratings
Report Delivery Scheduling
6.025 Ratings
8.21 Ratings
Report Versioning
00 Ratings
6.41 Ratings
Delivery to Remote Servers
00 Ratings
8.21 Ratings
Data Discovery and Visualization
Comparison of Data Discovery and Visualization features of Product A and Product B
Grow.com is well suited if you have a lot of data or client data to manage. If you do not have tons of data, there are other options out there that are a bit more simple and easy to use and a better price.
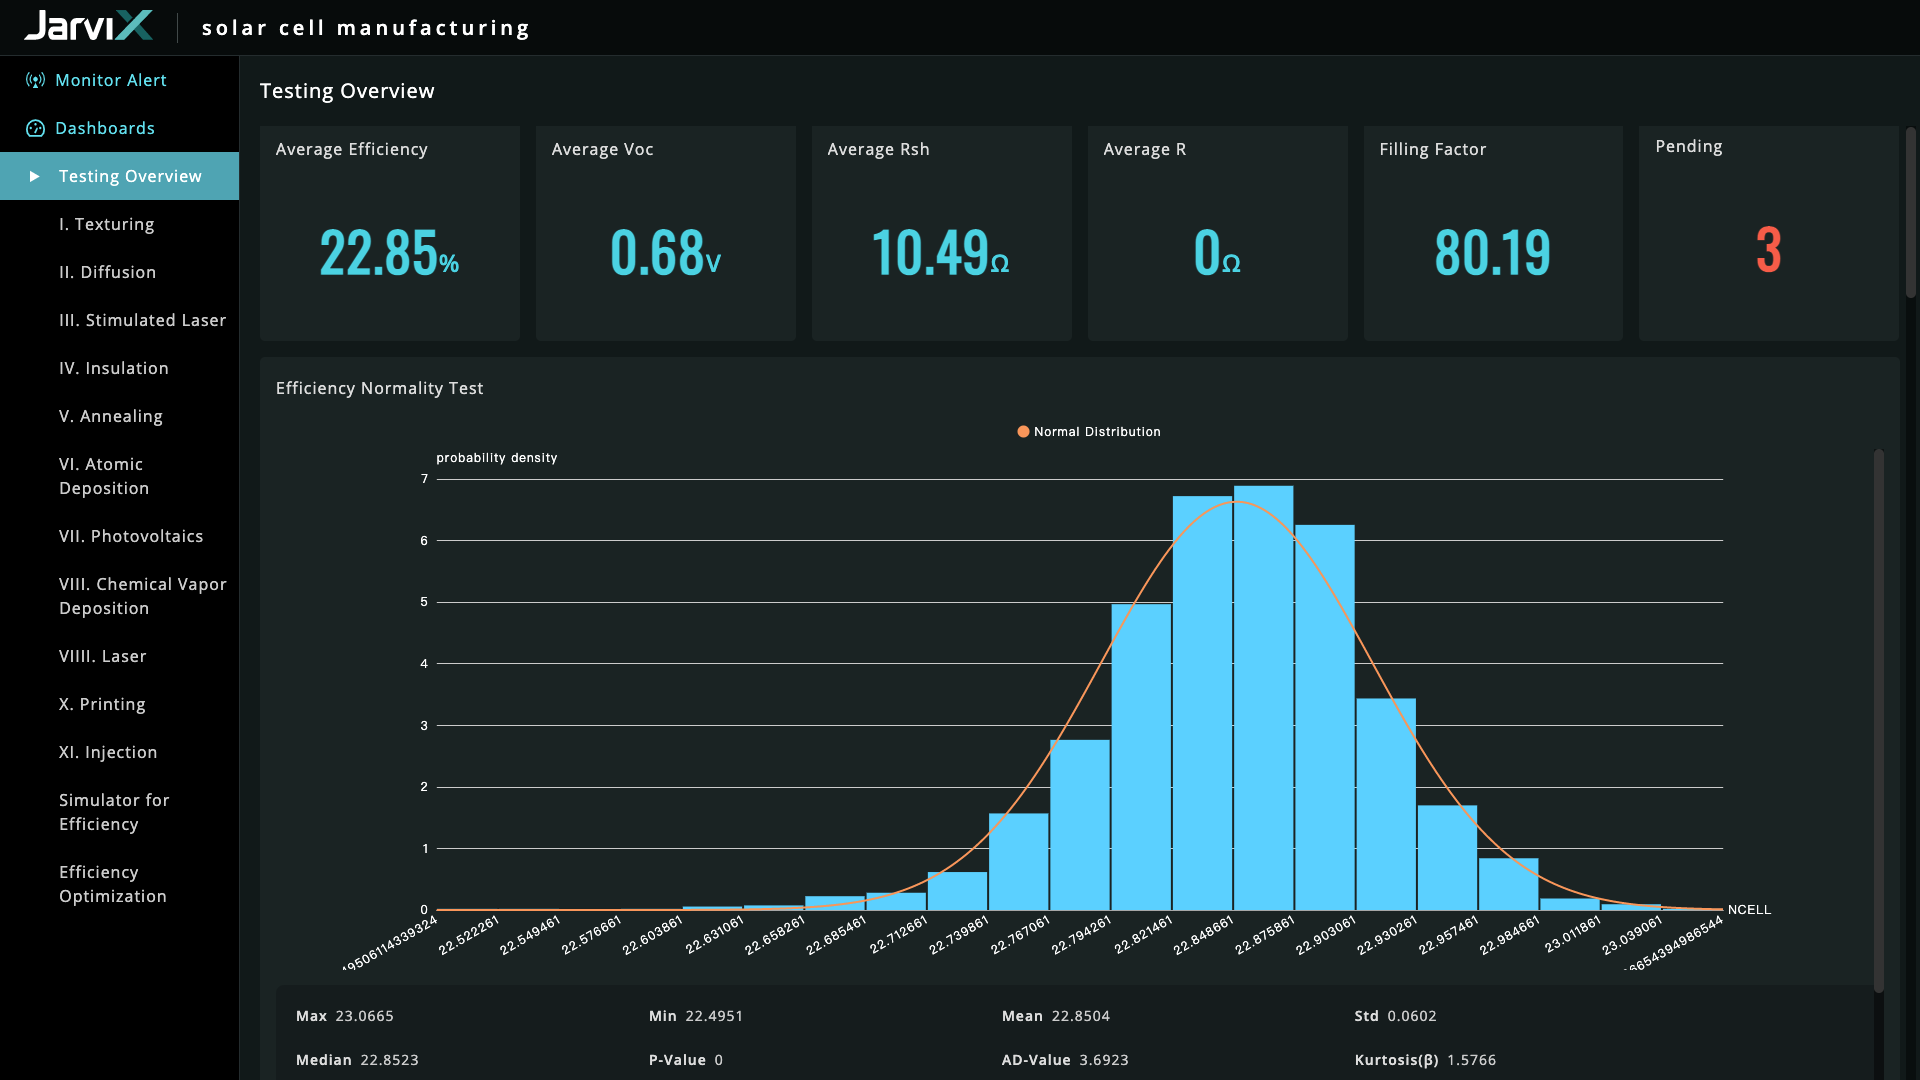
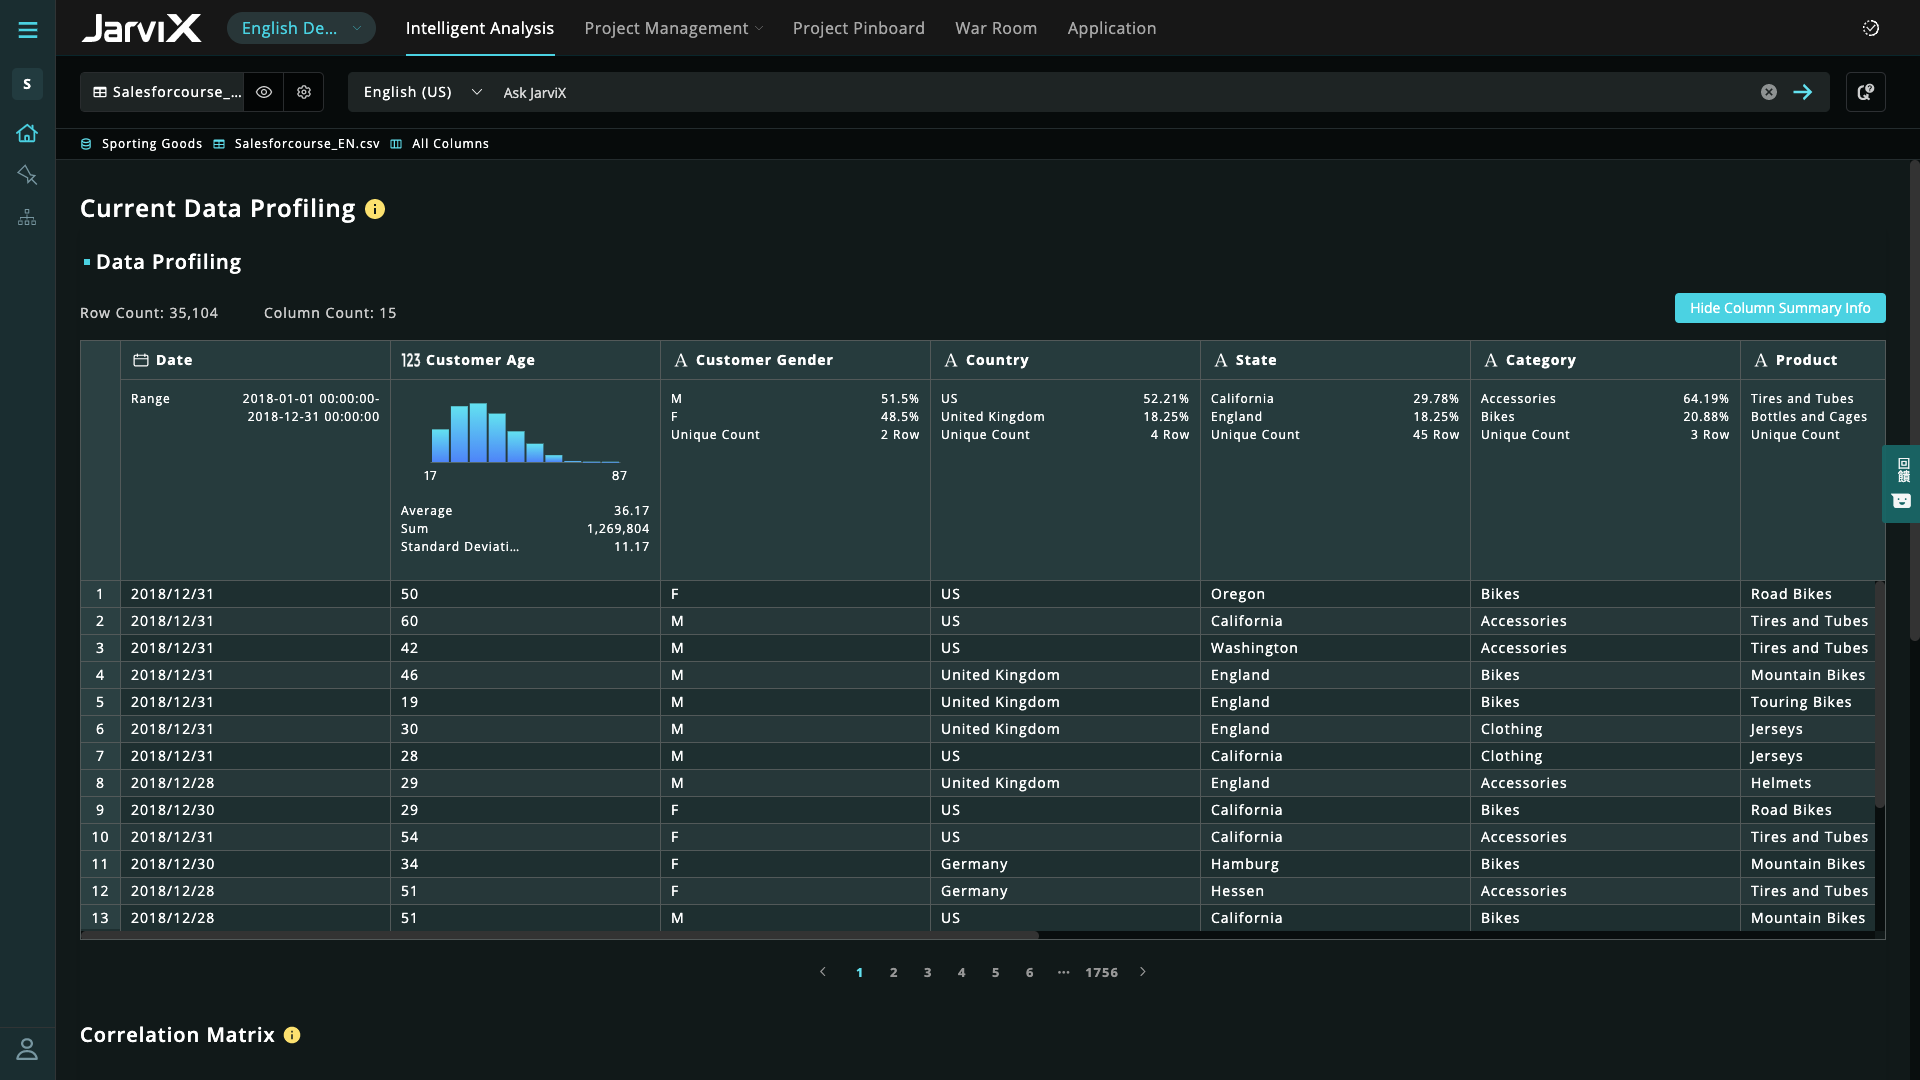
JarviX is very good at data integration, creating charts and reports for data visualization. It is really impressive that Jarvix can let our marketing team know the number of members living in a specific area in seconds. In addition, the product manager from Synergies is willing to help us with all problems we encounter. I accidentally changed one of the settings in a data table which threw the existing dashboard into chaos. However, after assistance from the product manager, we were able to successfully bring the data back to normal.
I love the fact that you have a team of developers who can help me build metrics or fix metrics that I do not create properly. I had to learn SQL in order to really build the metrics that mattered, which was a lot of fun, but resulted in many broken metrics. The vendor's team was great in responding to me requests for help!
Really, really appreciate the fact that Grow has SQL formulas to reference when building metrics. Again, as a novice, this accelerated my ability to learn and not have to leave your site and resources and stay within the Grow web properties.
Great account managers who check in regularly and are willing to help out whenever needed.
There should be more flexibility in changing the data tables uploaded into JarviX. For example, it should enable users to edit the syntax of the table or change the data format of the columns without affecting the existing dashboard and charts already created using that data table.
This tool is definitely a little bit difficult to be able to figure out at first, but after some time of learning you can definitely pick it up. I do wish there were more resources online that would be able to help speed up the learning process
The support team is very helpful and in every situation we have needed help in, they have been able to assist. So I have had a good experience with them
Grow doesn't have as many advanced analytics features and other capabilities as some other 'dashboard' platforms on the market. Simply, if you want a tool for internal use only that has high-level analytics capabilities (regressions, completely custom visualizations, modeling), Grow probably isn't the platform for you. To put it another way, if you have a team of data engineers and scientists doing complex analysis, Grow might not make the most sense. However, if you understand the value of data/visualization/dashboards, but lack some of those skillsets in your company, Grow might be the perfect fit. Not only is it incredibly scalable and reasonably priced compared to other market solutions, but their transform capabilities really stand out. They have many native data transformations that mimic SQL coding of a dataset, without requiring any knowledge of SQL. They've converted these transformations to easy-to-use tools in the platform, which are perfect for the less-technical user.
Tableau and Power BI. Obviously, they are not in the same category. Tableau and Power BI only provide data visualizations plus a little bit of analytics. JarviX not only provides data exploration, so you can find out what the problem is, as well as model management and App builder. If you only look for a dashboard, yes BI is probably enough, but if you constantly feel lacking actionable insights for actual implementations of improvements, JarviX is the choice for you.
I think the best part of JarviX is that we can get the analysis results in several minutes. We spent lots of time making reports and managing our data in the past. All in all, it helps us save the time, cost, and labor of managing data.