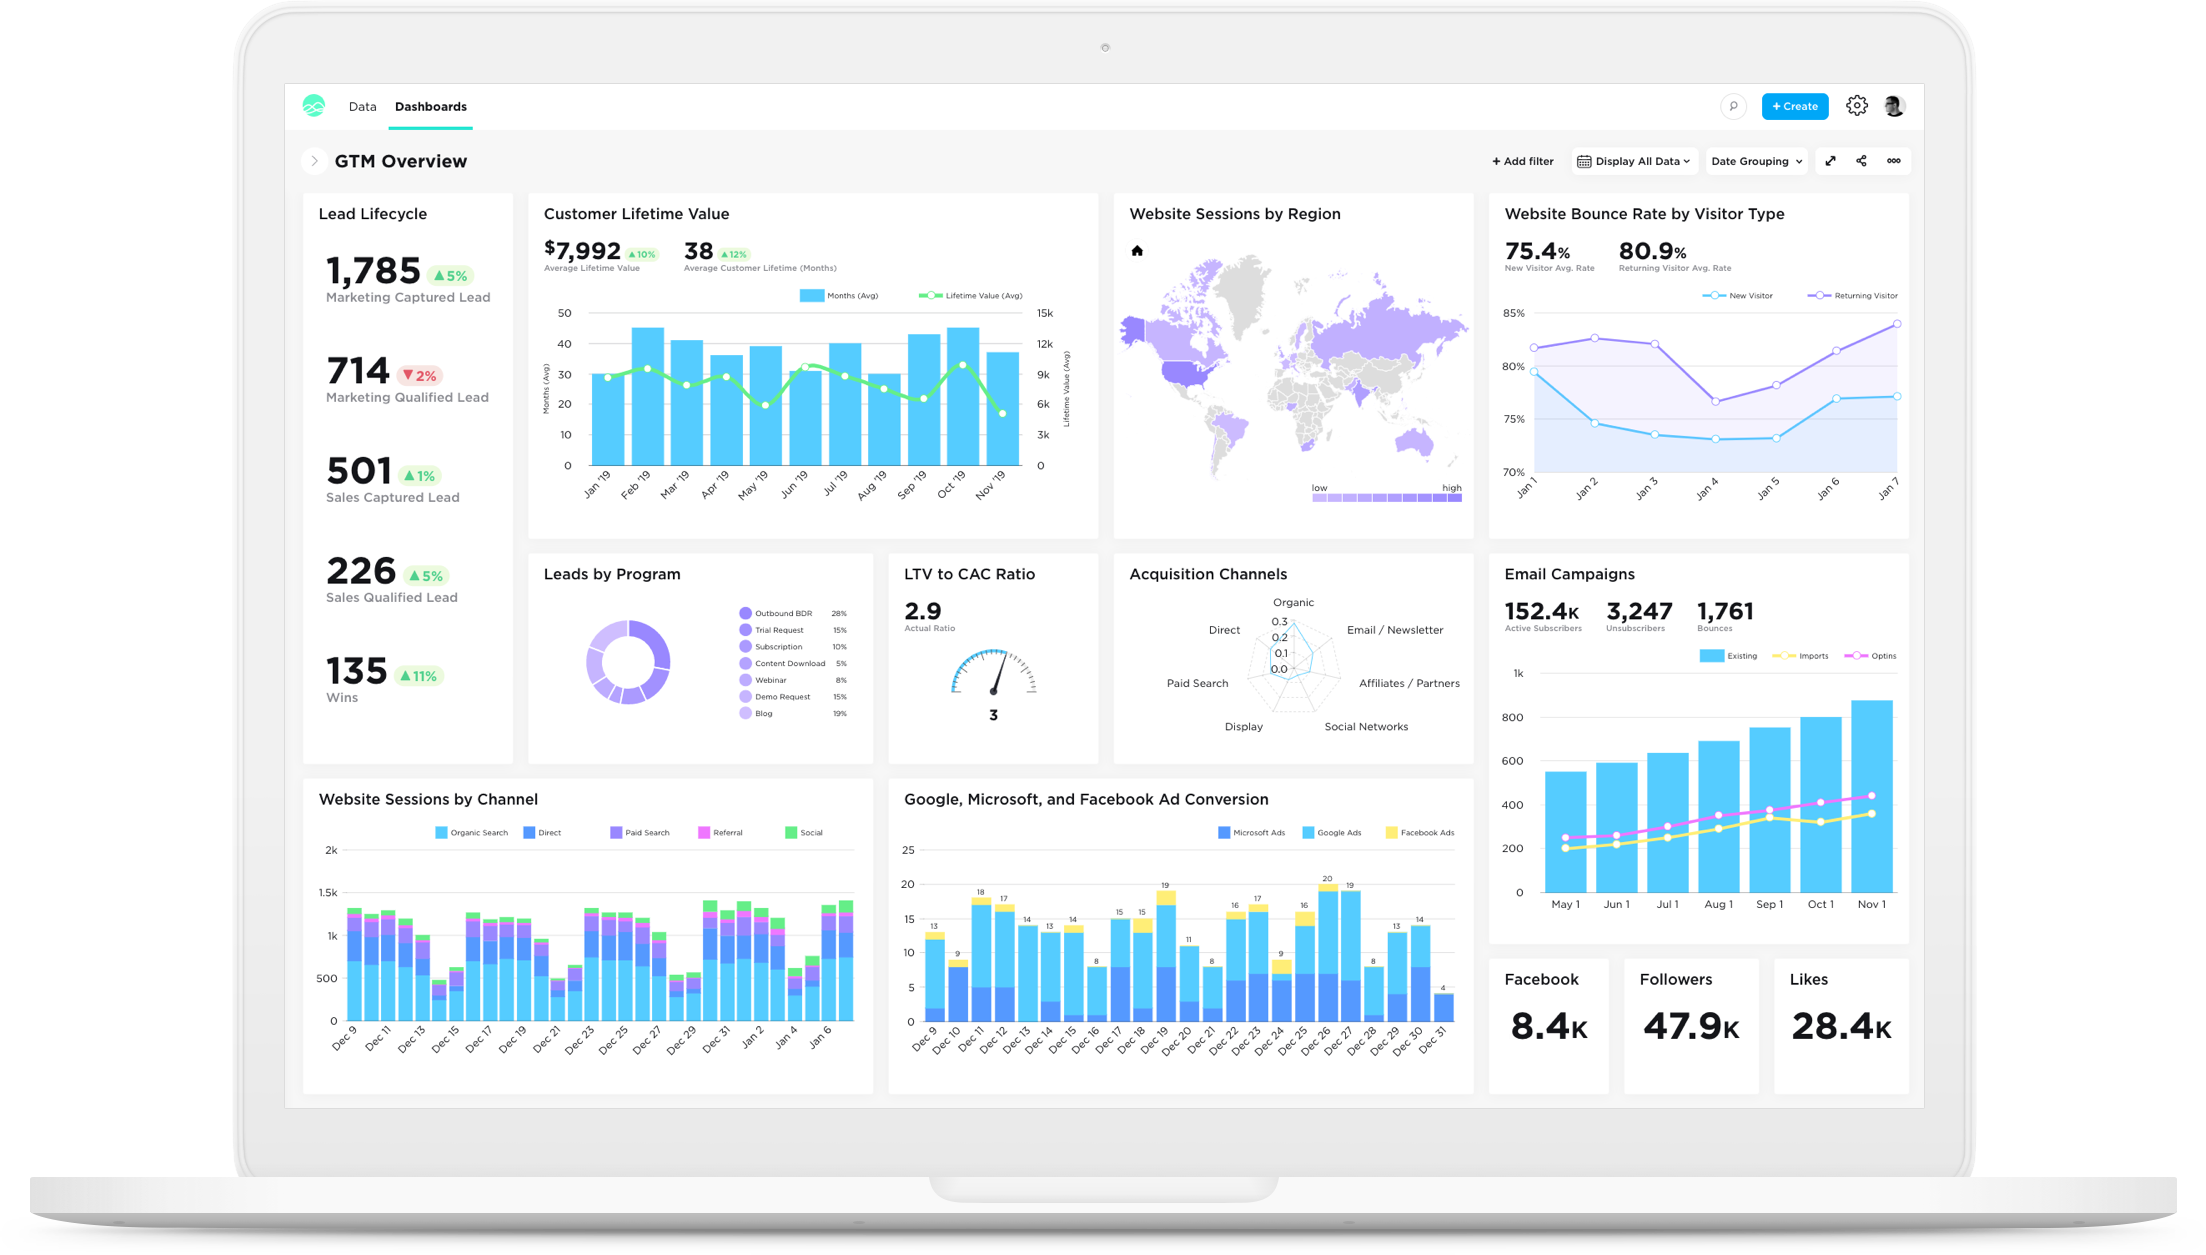
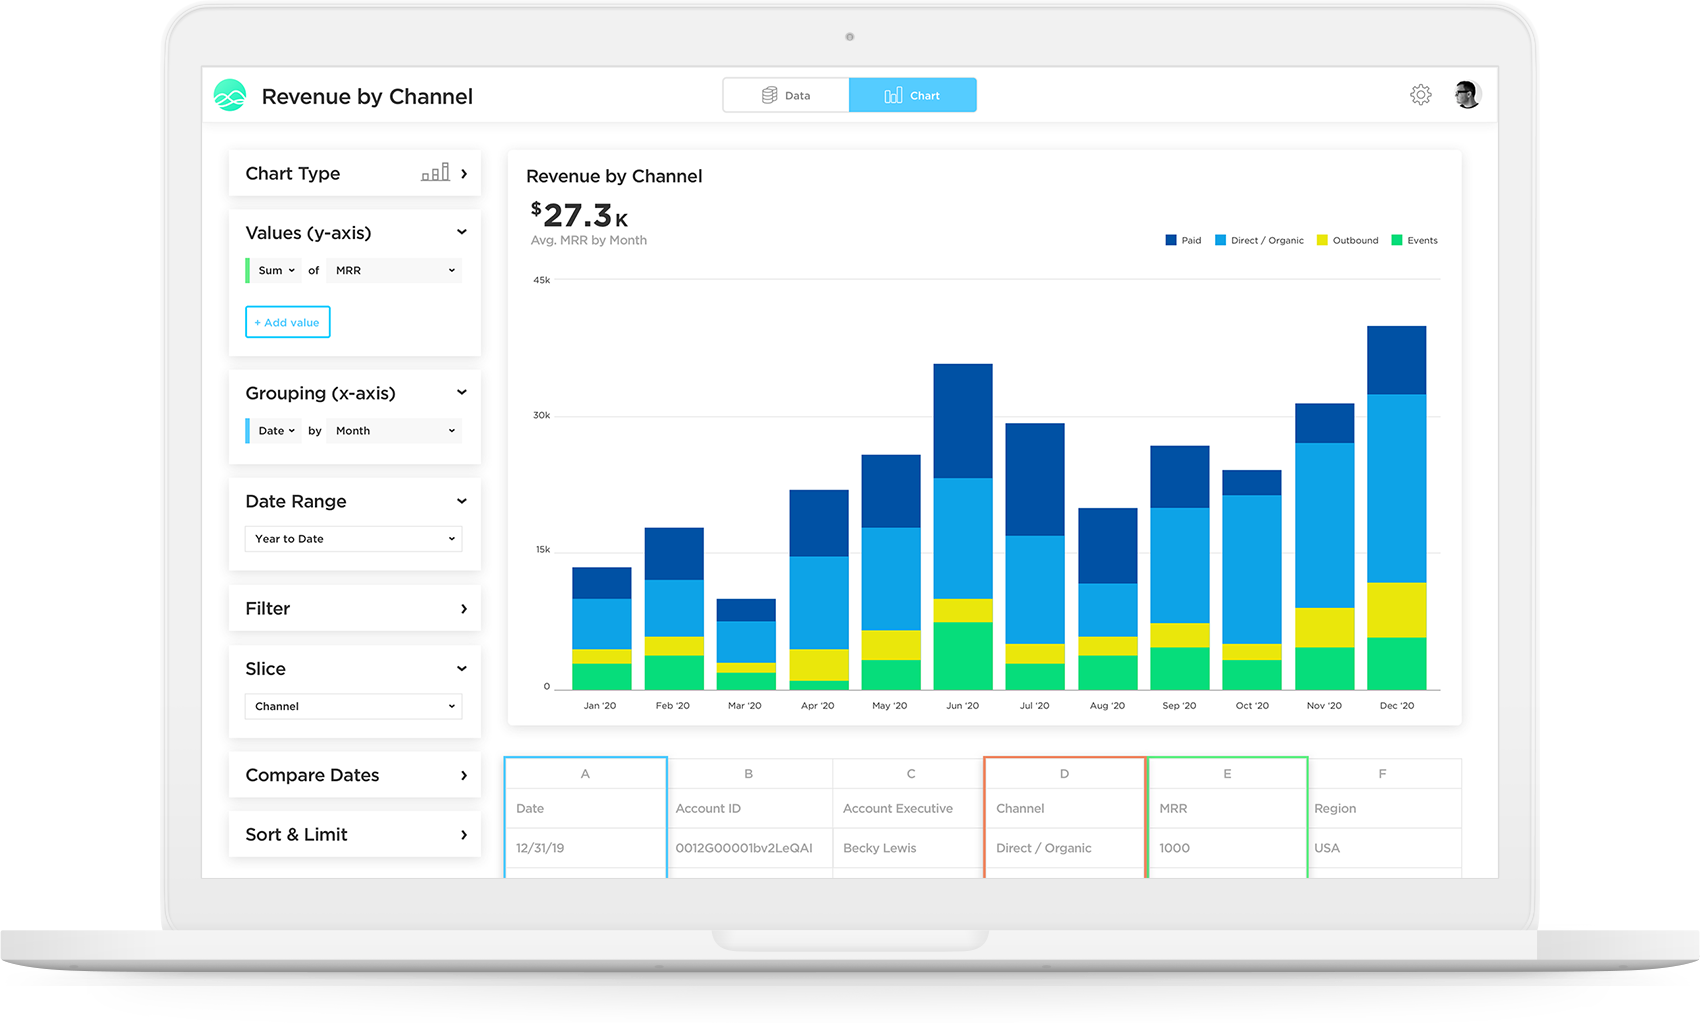
Grow, from Epicor since the March 2022 acquisition, is a business intelligence software that is designed to empower businesses to become data-driven and accelerate growth by aligning team objectives and inspiring strategic decisions.
N/A
Tableau Public
Score9.9 out of 10
N/A
Tableau Public is a free edition of the Desktop product. With this edition, data can only be published to the Tableau public website and does not allow work to be saved or exported locally.
Grow.com is well suited if you have a lot of data or client data to manage. If you do not have tons of data, there are other options out there that are a bit more simple and easy to use and a better price.
A de minimis incentive was given to thank the reviewer for their time. The incentive was not used to bias or drive a particular response, nor was the incentive contingent on a positive endorsement. More Info
Tableau public is the best platform to build dashboards for your personal profile and share with recruiters. It's always good to keep ourselves updated on the latest features, create sample dashboards and save them to a personal profile. Tableau public is free and doesn't need any subscription. anyone can create an account and start building reports.
I love the fact that you have a team of developers who can help me build metrics or fix metrics that I do not create properly. I had to learn SQL in order to really build the metrics that mattered, which was a lot of fun, but resulted in many broken metrics. The vendor's team was great in responding to me requests for help!
Really, really appreciate the fact that Grow has SQL formulas to reference when building metrics. Again, as a novice, this accelerated my ability to learn and not have to leave your site and resources and stay within the Grow web properties.
Great account managers who check in regularly and are willing to help out whenever needed.
A de minimis incentive was given to thank the reviewer for their time. The incentive was not used to bias or drive a particular response, nor was the incentive contingent on a positive endorsement. More Info
Data visualization: lots of different options, including bar, scatter, pie, waterfall charts to explore relationships between variables, and to present findings/trends to different teams
Integrates readily with limited, though different data sources: TXT, CSV, TDE, Access
Exports reports for review of different dashboards: client-ready/team-ready, with a clean and tidy presentation in PDF format (or hardcopy)
A de minimis incentive was given to thank the reviewer for their time. The incentive was not used to bias or drive a particular response, nor was the incentive contingent on a positive endorsement. More Info
A de minimis incentive was given to thank the reviewer for their time. The incentive was not used to bias or drive a particular response, nor was the incentive contingent on a positive endorsement. More Info
Tableau Public (both Desktop and Server) like their "for a fee" counterparts offer very easy to learn and use tools to transform data into pictures and gain insights into your data. Most organizations report a reduction in development time of 10x vs. other similar tools, due to the intuitive user interface. That said, with Tableau Public, published workbooks are "disconnected" from the underlying data sources and require periodic updates when the data changes. Users are limited to 1 Gb of storage space per user ID and password as well.
I would like to see better options for public sharing of visualizations and data from within the "for a fee" products as more and more organizations are moving in the direction of data sharing with partners and their communities.
A de minimis incentive was given to thank the reviewer for their time. The incentive was not used to bias or drive a particular response, nor was the incentive contingent on a positive endorsement. More Info
It's free, right? I'll keep using the free version. So the real question to ask is this? Will I pay $999 for the Personal version or $1,999 for the Professional? Yikes! That is a big stretch. I'm not sure about that. The product comparison chart is at: http://www.tableausoftware.com/public/comparison
This tool is definitely a little bit difficult to be able to figure out at first, but after some time of learning you can definitely pick it up. I do wish there were more resources online that would be able to help speed up the learning process
A de minimis incentive was given to thank the reviewer for their time. The incentive was not used to bias or drive a particular response, nor was the incentive contingent on a positive endorsement. More Info
Tableau public is a great training tool to understand the basics of Tableau before buying it. A great tool to extend Excel's visualization and to publish data for others. Not useful for anything you need secure. No ability to access databases. Static information only.
The support team is very helpful and in every situation we have needed help in, they have been able to assist. So I have had a good experience with them
A de minimis incentive was given to thank the reviewer for their time. The incentive was not used to bias or drive a particular response, nor was the incentive contingent on a positive endorsement. More Info
A de minimis incentive was given to thank the reviewer for their time. The incentive was not used to bias or drive a particular response, nor was the incentive contingent on a positive endorsement. More Info
Start at the end and work backward. Identify the business case / issue and questions the end users have, then identify the data needed, and where to get it.
A de minimis incentive was given to thank the reviewer for their time. The incentive was not used to bias or drive a particular response, nor was the incentive contingent on a positive endorsement. More Info
Grow doesn't have as many advanced analytics features and other capabilities as some other 'dashboard' platforms on the market. Simply, if you want a tool for internal use only that has high-level analytics capabilities (regressions, completely custom visualizations, modeling), Grow probably isn't the platform for you. To put it another way, if you have a team of data engineers and scientists doing complex analysis, Grow might not make the most sense. However, if you understand the value of data/visualization/dashboards, but lack some of those skillsets in your company, Grow might be the perfect fit. Not only is it incredibly scalable and reasonably priced compared to other market solutions, but their transform capabilities really stand out. They have many native data transformations that mimic SQL coding of a dataset, without requiring any knowledge of SQL. They've converted these transformations to easy-to-use tools in the platform, which are perfect for the less-technical user.
A de minimis incentive was given to thank the reviewer for their time. The incentive was not used to bias or drive a particular response, nor was the incentive contingent on a positive endorsement. More Info
Google Charts/Drive is sufficient for simpler data sets, but it does not integrate with other web platforms and the visualization does not look as professional. I'm not aware of any other competitors that offer the same package as Microsoft.
A de minimis incentive was given to thank the reviewer for their time. The incentive was not used to bias or drive a particular response, nor was the incentive contingent on a positive endorsement. More Info
A de minimis incentive was given to thank the reviewer for their time. The incentive was not used to bias or drive a particular response, nor was the incentive contingent on a positive endorsement. More Info
A de minimis incentive was given to thank the reviewer for their time. The incentive was not used to bias or drive a particular response, nor was the incentive contingent on a positive endorsement. More Info