Grafana vs. Jet Reports
Grafana vs. Jet Reports
| Product | Rating | Most Used By | Product Summary | Starting Price |
|---|---|---|---|---|
 Grafana | N/A | Grafana is a data visualization tool developed by Grafana Labs in New York. It is available open source, managed (Grafana Cloud), or via an enterprise edition with enhanced features. Grafana has pluggable data source model and comes bundled with support for popular time series databases like Graphite. It also has built-in support for cloud monitoring vendors like Amazon Cloudwatch, Microsoft Azure and SQL databases like MySQL. Grafana can combine data from many places into a single dashboard. | $0 | |
 Jet Reports | N/A | Jet Reports is a business intelligence software now offered by insightsoftware, inc since the company's 2019 acquisition of Jet Global Data Technologies. | N/A |
| Grafana | Jet Reports | |||||||||||||||
|---|---|---|---|---|---|---|---|---|---|---|---|---|---|---|---|---|
| Editions & Modules |
| No answers on this topic | ||||||||||||||
| Offerings |
| |||||||||||||||
| Entry-level Setup Fee | No setup fee | No setup fee | ||||||||||||||
| Additional Details | — | — | ||||||||||||||
| More Pricing Information | ||||||||||||||||
| Grafana | Jet Reports |
|---|
| Grafana | Jet Reports | ||||||||||||||||||
|---|---|---|---|---|---|---|---|---|---|---|---|---|---|---|---|---|---|---|---|
| BI Standard Reporting |
| ||||||||||||||||||
| Ad-hoc Reporting |
| ||||||||||||||||||
| Report Output and Scheduling |
| ||||||||||||||||||
| Data Discovery and Visualization |
|
| Grafana | Jet Reports | |
|---|---|---|
| Likelihood to Recommend | 9.4 (7 ratings) | 7.0 (5 ratings) |
| Usability | 9.6 (3 ratings) | 6.0 (1 ratings) |
| Support Rating | - (0 ratings) | 5.0 (1 ratings) |
| Grafana | Jet Reports | |
|---|---|---|
| Likelihood to Recommend | Grafana Labs
| Insightsoftware, Inc
 Grant Nelson, CPA Accounting Manager |
| Pros | Grafana Labs
| Insightsoftware, Inc
 Ojas Korde Digital Paid Media Strategist |
| Cons | Grafana Labs
 ANurag Tamrakar Software Engineer - DevOps | Insightsoftware, Inc
|
| Usability | Grafana Labs
| Insightsoftware, Inc
Ojas Korde Digital Paid Media Strategist |
| Support Rating | Grafana Labs No answers on this topic | Insightsoftware, Inc
Ojas Korde Digital Paid Media Strategist |
| Alternatives Considered | Grafana Labs
| Insightsoftware, Inc
 Matt Scamardo, CSM Consulting Solutions Analyst |
| Return on Investment | Grafana Labs
| Insightsoftware, Inc
Ojas Korde Digital Paid Media Strategist |
| ScreenShots | Jet Reports Screenshots 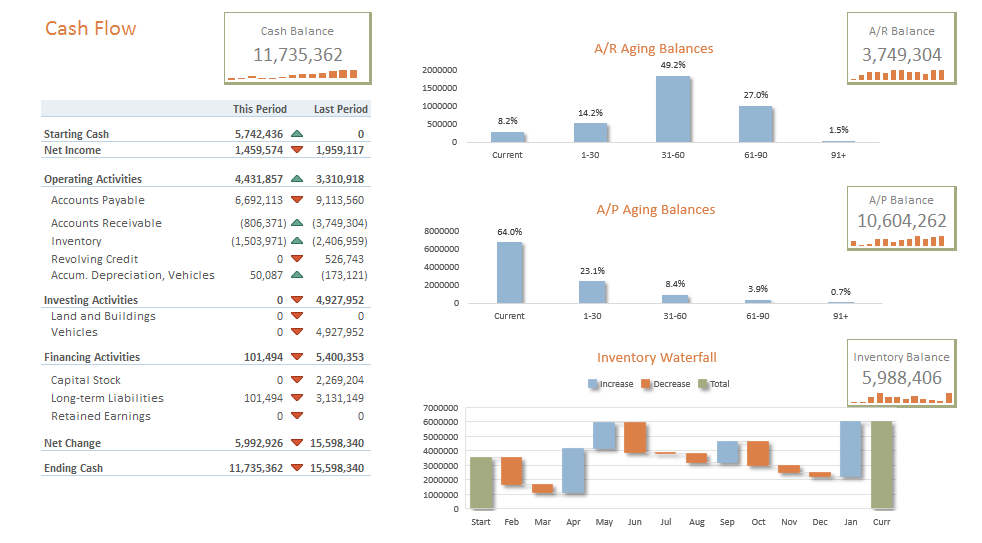     |