Grafana is a data visualization tool developed by Grafana Labs in New York. It is available open source, managed (Grafana Cloud), or via an enterprise edition with enhanced features. Grafana has pluggable data source model and comes bundled with support for popular time series databases like Graphite. It also has built-in support for cloud monitoring vendors like Amazon Cloudwatch, Microsoft Azure and SQL databases like MySQL. Grafana can combine data from many places into a single dashboard.
$0
NetApp Cloud Insights
Score 9.2 out of 10
N/A
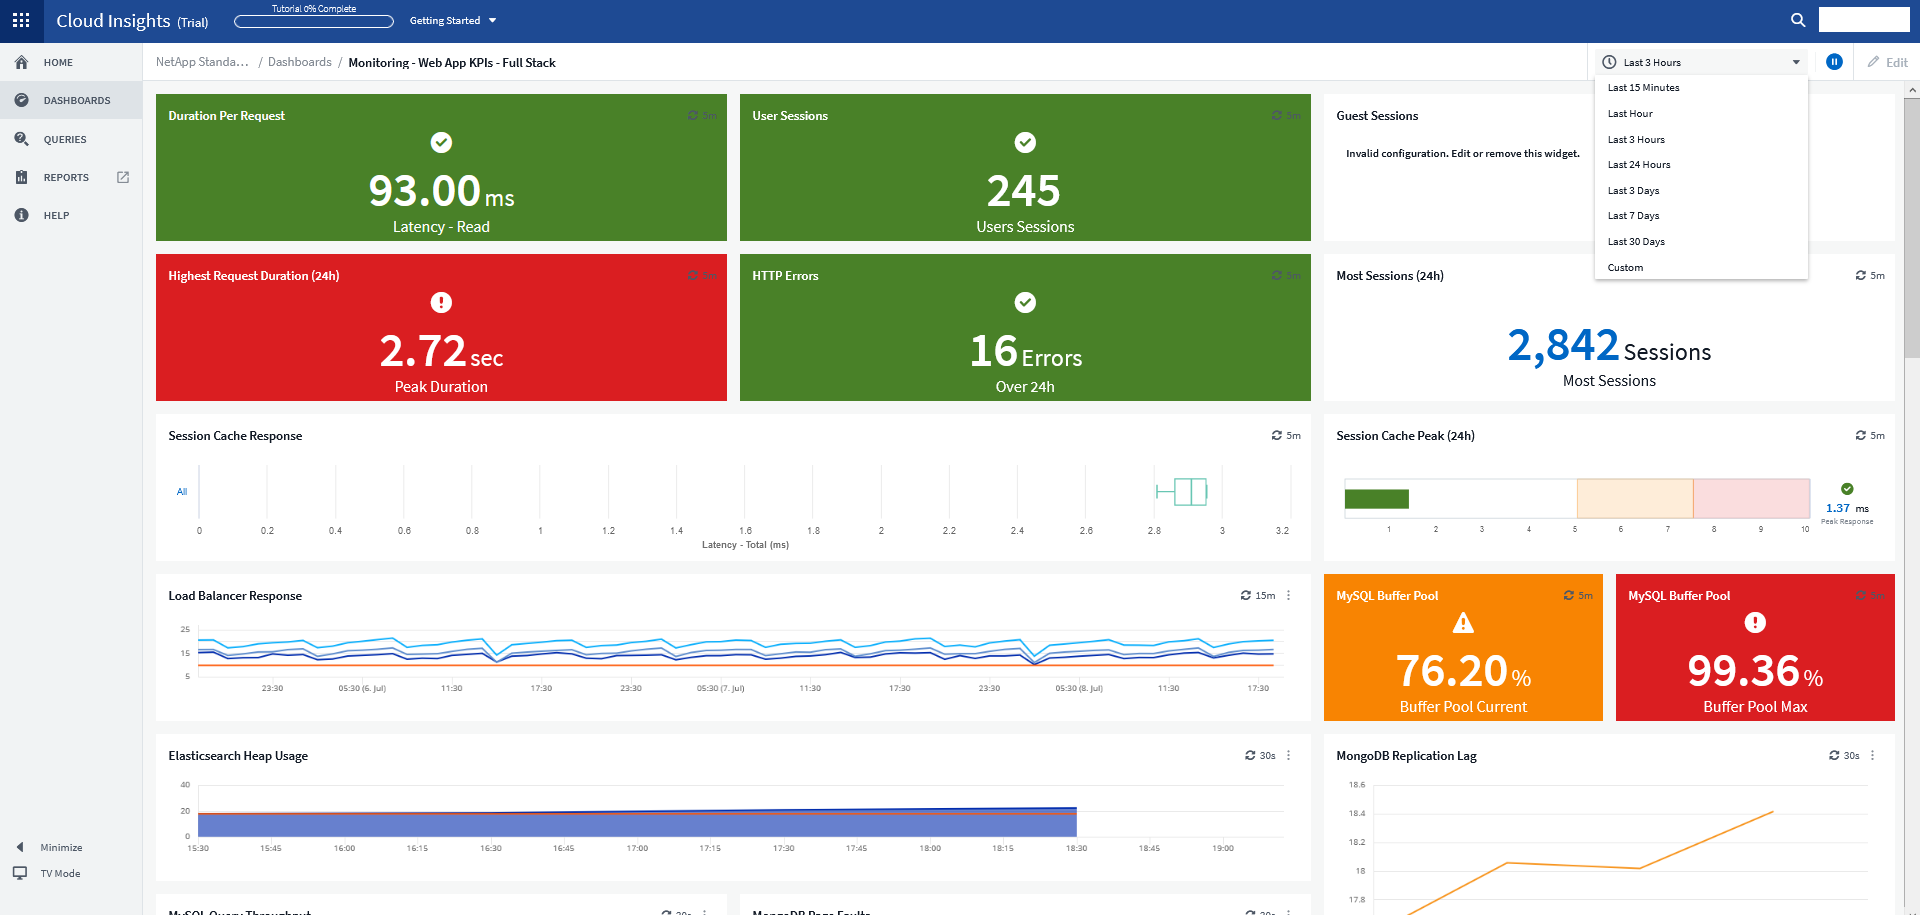
NetApp Cloud Insights is an infrastructure monitoring tool that gives
users visibility into their complete infrastructure. With Cloud Insights, users can monitor, troubleshoot and optimize all resources including
public clouds and private data centers.
N/A
Pricing
Grafana
NetApp Cloud Insights
Editions & Modules
Grafana Cloud - Pro
$8
per month up to 1 active user
Grafana Cloud - Free
Free
10k metrics + 50GB logs + 50GB traces up to 3 active users
Grafana Cloud - Advanced
Volume Discounts
custom data usage custom active users
Grafana - Enterprise Stack
Custom Pricing
No answers on this topic
Offerings
Pricing Offerings
Grafana
NetApp Cloud Insights
Free Trial
Yes
Yes
Free/Freemium Version
Yes
Yes
Premium Consulting/Integration Services
No
Yes
Entry-level Setup Fee
No setup fee
Optional
Additional Details
—
—
More Pricing Information
Community Pulse
Grafana
NetApp Cloud Insights
Features
Grafana
NetApp Cloud Insights
BI Standard Reporting
Comparison of BI Standard Reporting features of Product A and Product B
Grafana
8.3
7 Ratings
3% above category average
NetApp Cloud Insights
-
Ratings
Pixel Perfect reports
8.17 Ratings
00 Ratings
Customizable dashboards
8.37 Ratings
00 Ratings
Report Formatting Templates
8.47 Ratings
00 Ratings
Ad-hoc Reporting
Comparison of Ad-hoc Reporting features of Product A and Product B
Grafana
8.1
6 Ratings
4% above category average
NetApp Cloud Insights
-
Ratings
Drill-down analysis
8.16 Ratings
00 Ratings
Formatting capabilities
8.46 Ratings
00 Ratings
Integration with R or other statistical packages
7.96 Ratings
00 Ratings
Report sharing and collaboration
8.05 Ratings
00 Ratings
Report Output and Scheduling
Comparison of Report Output and Scheduling features of Product A and Product B
Grafana
8.4
6 Ratings
3% above category average
NetApp Cloud Insights
-
Ratings
Publish to Web
8.26 Ratings
00 Ratings
Publish to PDF
8.66 Ratings
00 Ratings
Report Versioning
8.26 Ratings
00 Ratings
Report Delivery Scheduling
8.46 Ratings
00 Ratings
Delivery to Remote Servers
8.66 Ratings
00 Ratings
Data Discovery and Visualization
Comparison of Data Discovery and Visualization features of Product A and Product B
Just about any organization with more than one server and more than one cluster as it scales very well. Configuration of the application takes time and finesse to fine tune to where the balance of load time and getting data quickly meets. The plugins add load time but fine tuning for the application to meet demand needs nailed down at implementation
For example, we had an application slowdown. It looked like the slowdown was storage. However, it was a malformed SQL query that no one realized was pulling data from the storage location that also housed the application. Cloud Insights saved us hours of downtime and frustration. Cloud Insights pinpointed which system was hogging resources. What makes Cloud Insights special is the way it looks at the data collected from the data sources. The insights it provides into the flow of data; sheds new light on how things work in your environment.
It is infinitely flexible. If you can imagine it, Grafana can almost certainly do it. Usability may be in the eye of the beholder however, as there is time needed to curate the experience and get the dashboards customized to how it makes sense to you. I know one thing they are working on are more templates, based on data sources
I have been extremely happy with its usability. You can take thins as they are out of the box and it is useful. You can carry it as far as you want to go and every step you take improves your ROI.
Grafana blows Nagios out of the water when it comes to customization. The ability to feed almost any data source makes it very versatile and the cost is great.
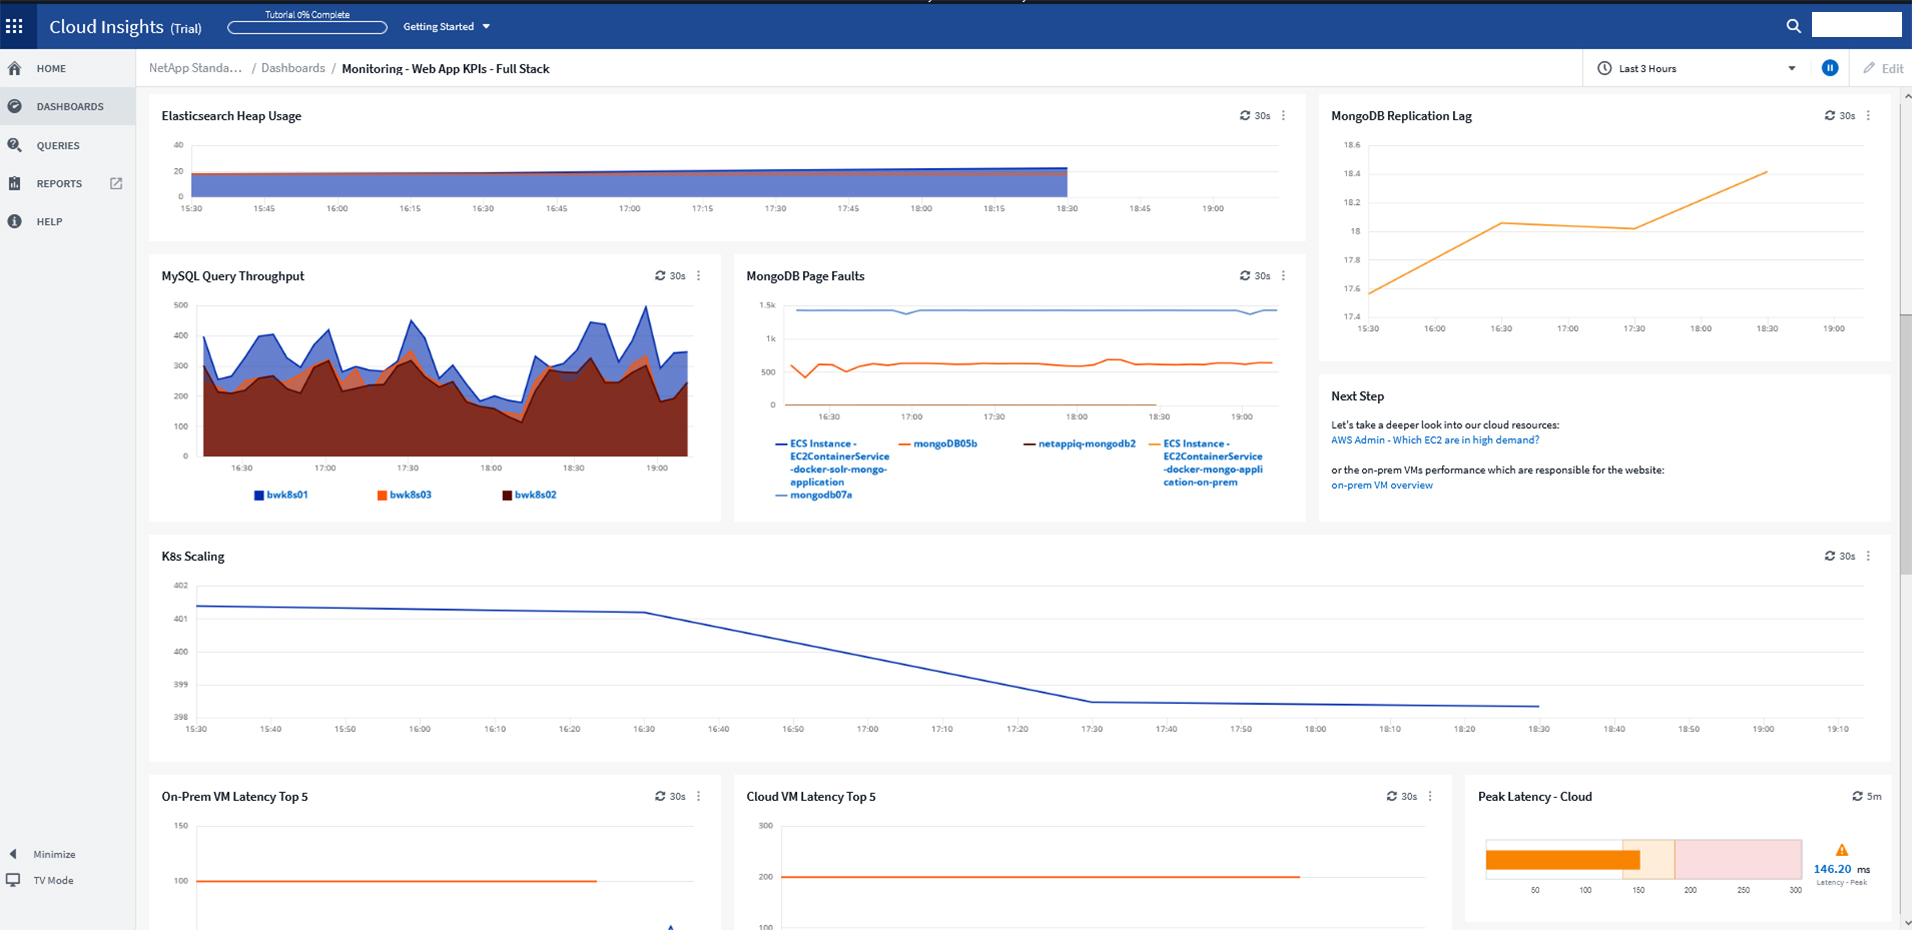
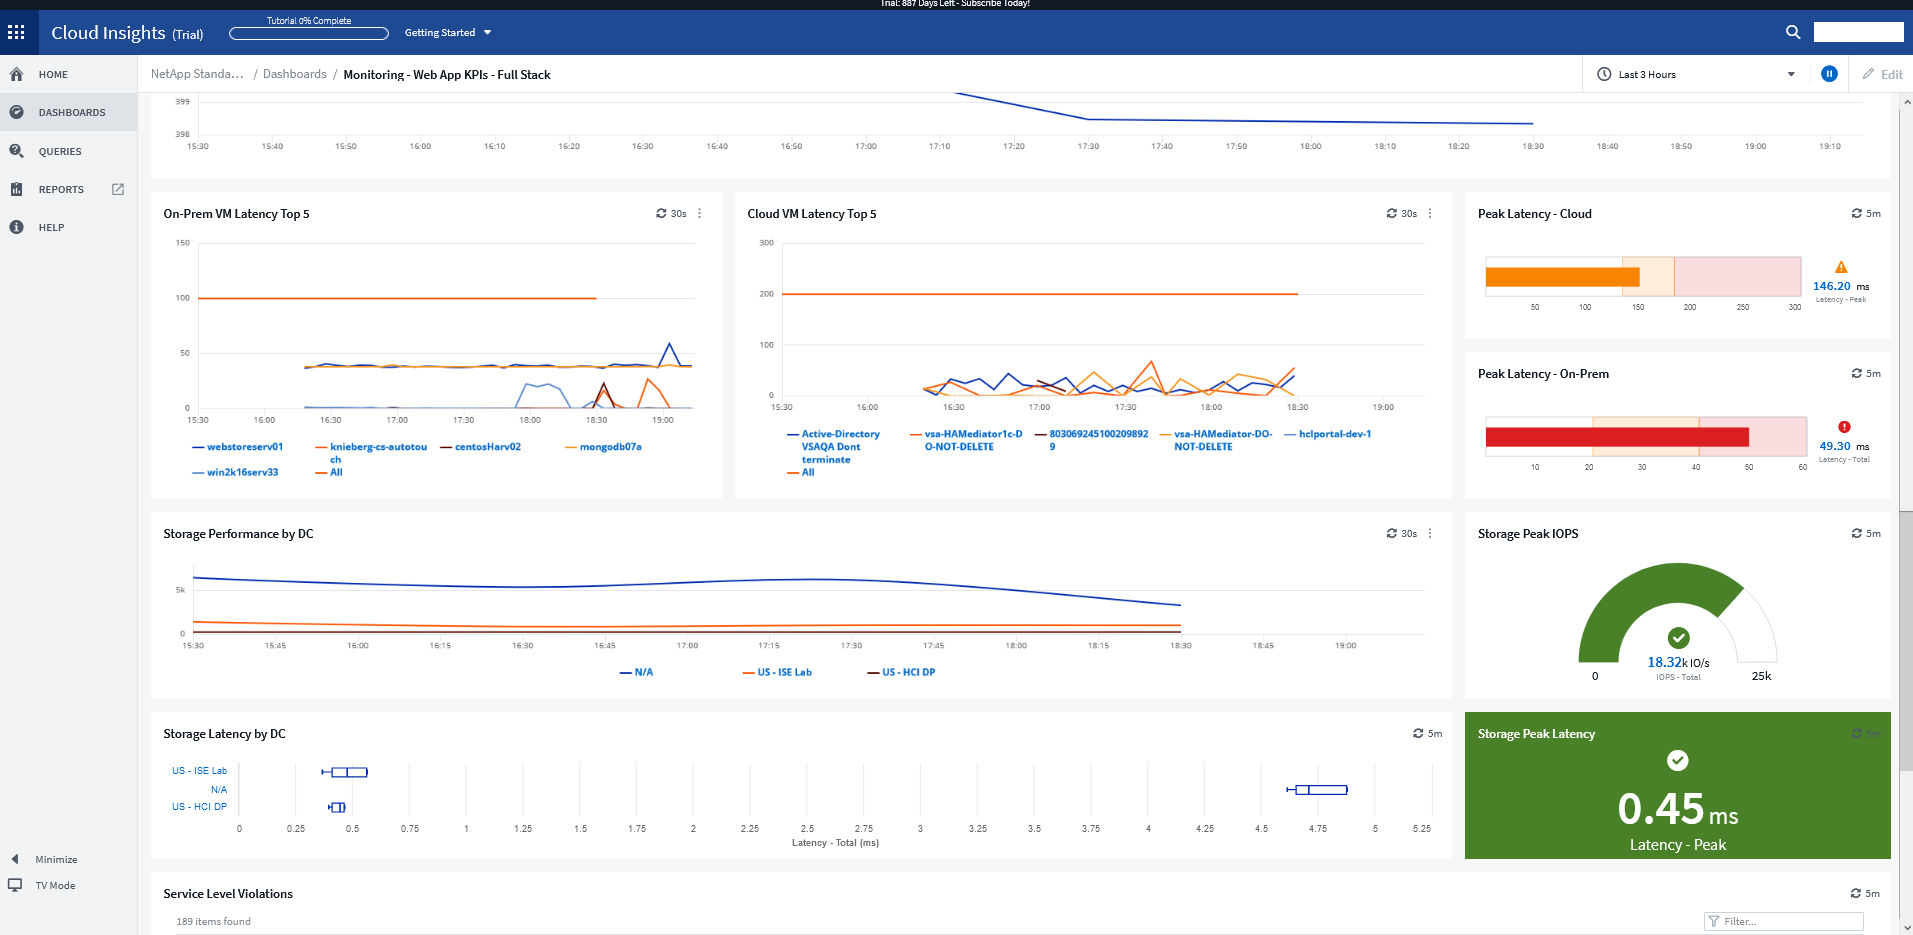
For a while, we were using Zabbix to monitor our Kubernetes applications and microservices on our infrastructure in more than one public cloud platform. Cloud Insights has much better visualized dashboards. In addition, despite such a large number of quality features, it's still priced competitively.
Once you install the acquisition unit and start collecting data, you can immediately begin using it. It is very self-explanatory and helpful. I could have used Cloud Insights without working with the NetApp Cloud Insights support team. I am glad I engaged them though. They helped me carry Cloud Insights to a new level and it fast-tracked the process that would have taken me time to complete.