Grist vs. Plotly Chart Studio
Grist vs. Plotly Chart Studio
| Product | Rating | Most Used By | Product Summary | Starting Price |
|---|---|---|---|---|
 Grist | N/A | Grist combines the capabilities of spreadsheets, databases and app builders. Using a familiar spreadsheet interface, information can be organized as a relational database, and dashboards built using drag-and-drop. Solving spreadsheet problems Ensures data is well-structured and stored in one place with no duplication, no spreadsheet-wrangling, no merging documents. Collaboration on sensitive data Data is protected… | $8 per month per user | |
 Plotly Chart Studio | N/A | Plotly headquartered in Montreal offers Chart Studio, a data visualization tool with an open source and free cloud editions, as well as enterprise editions deployable on-cloud or on-premise. The vendor describes Chart Studio as a sophisticated editor for creating D3.js and WebGL charts. | $99 per month |
| Grist | Plotly Chart Studio | |||||||||||||||
|---|---|---|---|---|---|---|---|---|---|---|---|---|---|---|---|---|
| Editions & Modules |
|
| ||||||||||||||
| Offerings |
| |||||||||||||||
| Entry-level Setup Fee | No setup fee | No setup fee | ||||||||||||||
| Additional Details | — | — | ||||||||||||||
| More Pricing Information | ||||||||||||||||
| Grist | Plotly Chart Studio |
|---|
| Grist | Plotly Chart Studio | |||||||||
|---|---|---|---|---|---|---|---|---|---|---|
| BI Standard Reporting |
| |||||||||
| Ad-hoc Reporting |
| |||||||||
| Data Discovery and Visualization |
|
| Grist | Plotly Chart Studio | |
|---|---|---|
| Small Businesses |  Stackby Score 9.0 out of 10 |  Supermetrics Score 9.8 out of 10 |
| Medium-sized Companies |  Microsoft Excel Score 8.9 out of 10 | Supermetrics Score 9.8 out of 10 |
| Enterprises | Microsoft Excel Score 8.9 out of 10 |  IBM Analytics Engine Score 7.2 out of 10 |
| All Alternatives | View all alternatives | View all alternatives |
| Grist | Plotly Chart Studio | |
|---|---|---|
| Likelihood to Recommend | 9.9 (2 ratings) | 8.0 (2 ratings) |
| Grist | Plotly Chart Studio | |
|---|---|---|
| Likelihood to Recommend | Grist Labs
| Plotly
|
| Pros | Grist Labs
| Plotly
 Annie Jain Consultant |
| Cons | Grist Labs
| Plotly
|
| Alternatives Considered | Grist Labs
| Plotly |
| Return on Investment | Grist Labs
| Plotly
Annie Jain Consultant |
| ScreenShots | Grist Screenshots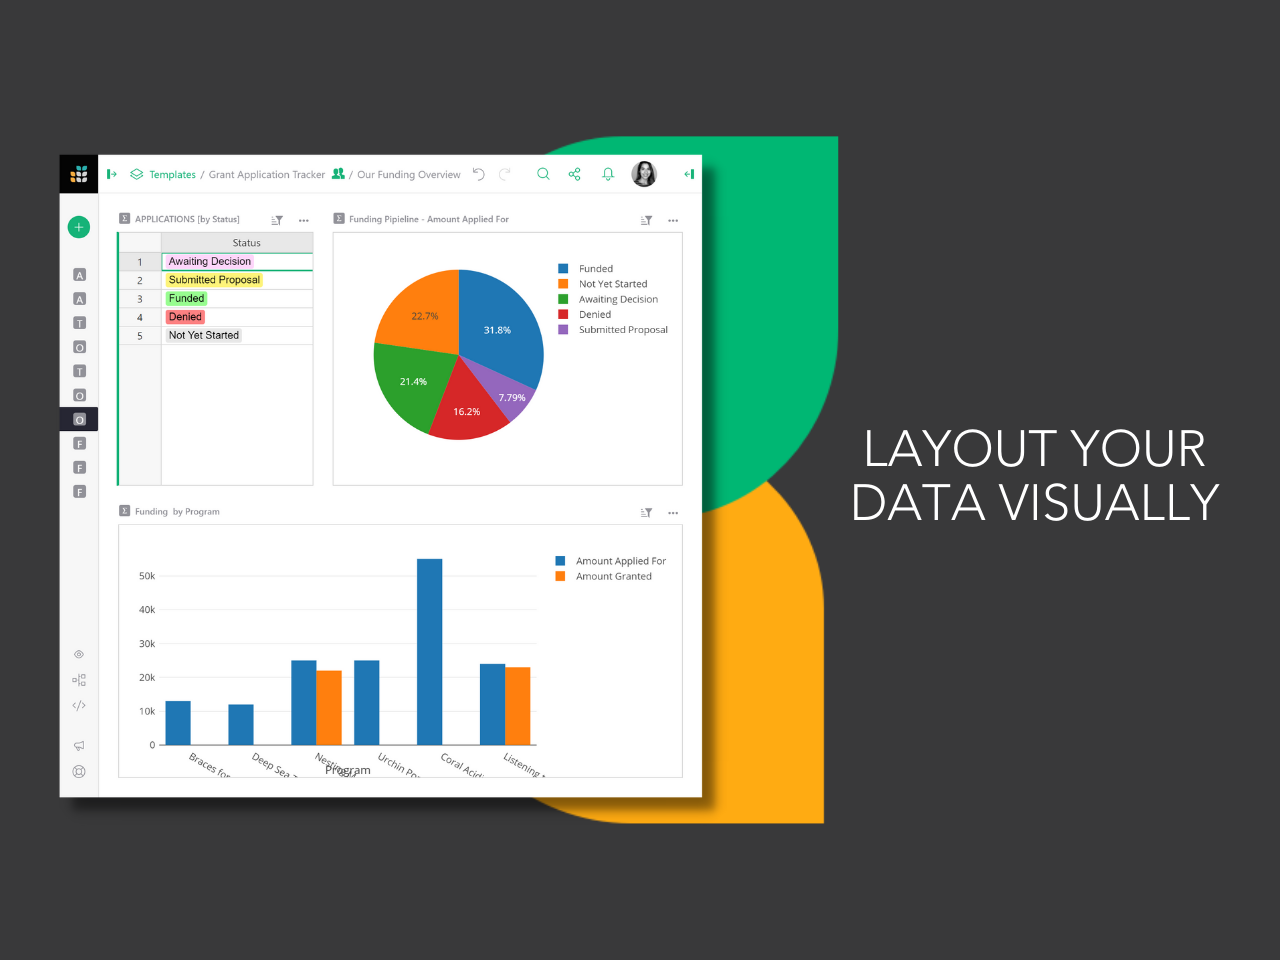  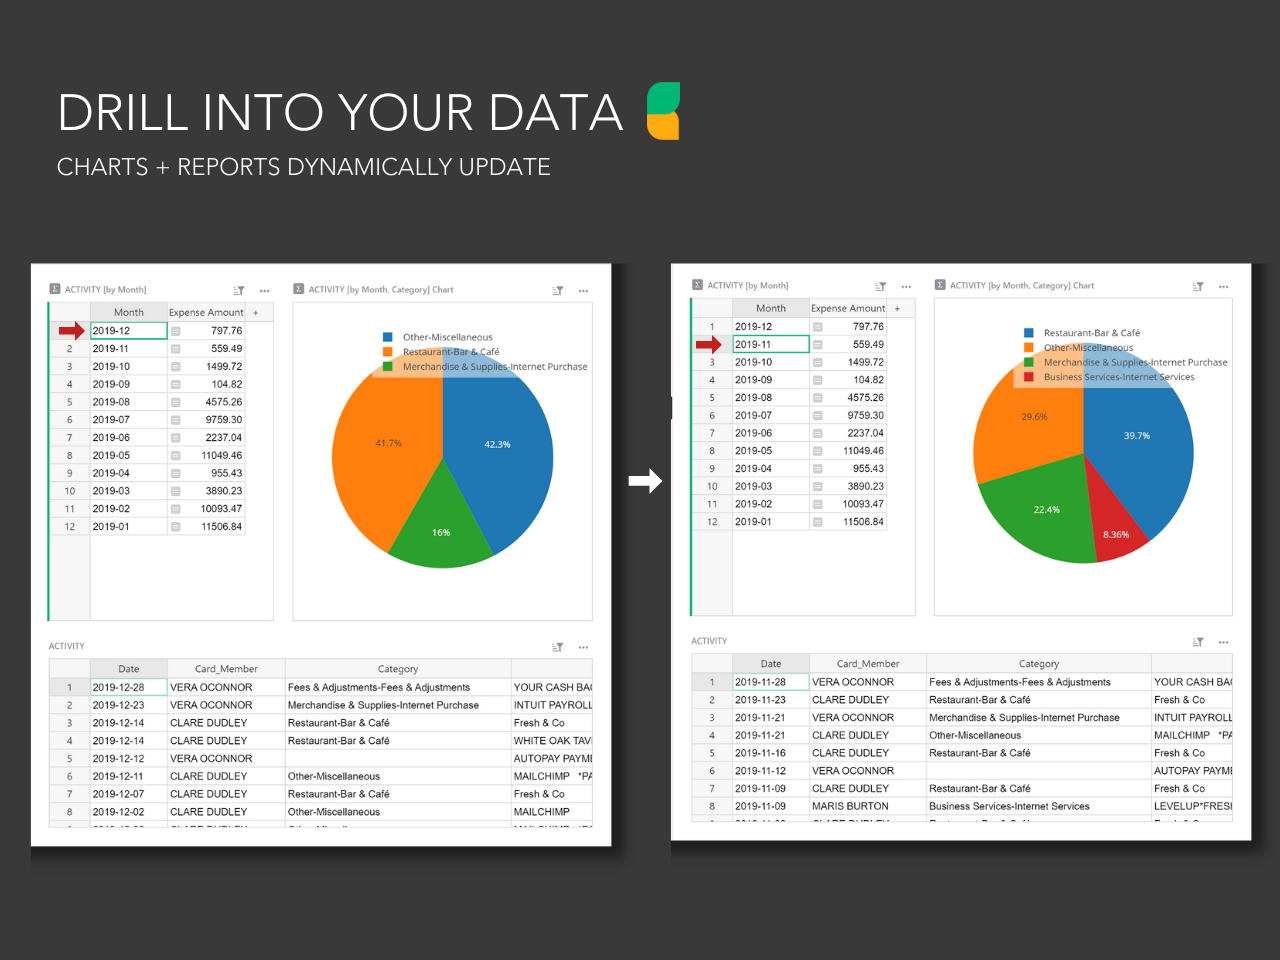  |