TrustRadius: an HG Insights company

Save this comparison

Save this comparison

Add Product

Recommended Comparisons

    Overview
    ProductRatingMost Used ByProduct SummaryStarting Price

    IBM SPSS Modeler

    Score9.6 out of 10
    N/AIBM SPSS Modeler is a visual data science and machine learning (ML) solution designed to help enterprises accelerate time to value by speeding up operational tasks for data scientists. Organizations can use it for data preparation and discovery, predictive analytics, model management and deployment, and ML to monetize data assets.

    $499

    per month

    SAS Visual Analytics

    Score7.8 out of 10
    Enterprise companies (1,001+ employees)
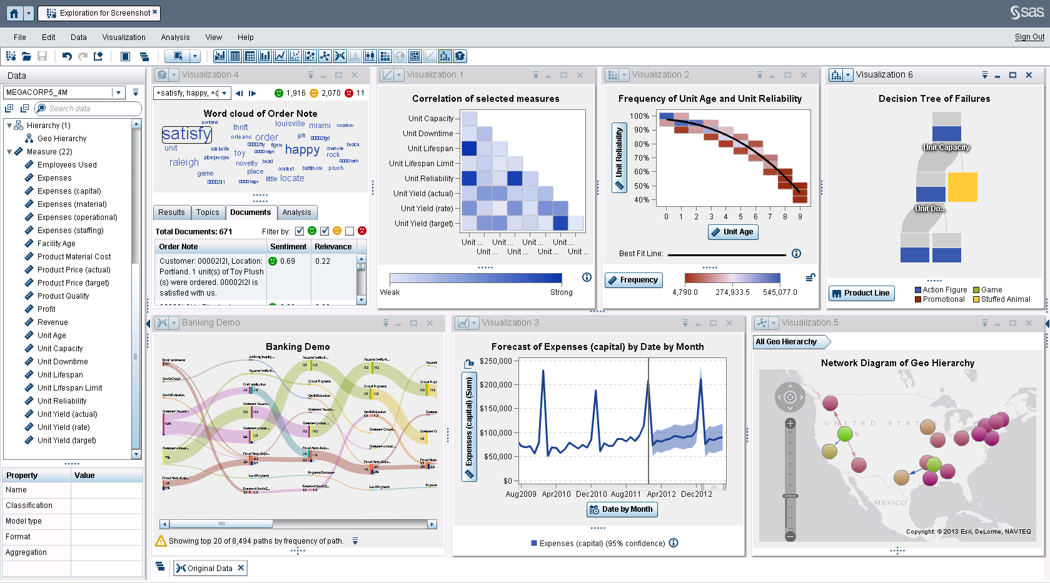
    SAS Visual Analytics provides a complete platform for analytics visualization, enabling users to identify patterns and relationships in data that weren't initially evident. Interactive, self-service BI and reporting capabilities are combined with out-of-the-box advanced analytics so everyone can discover insights from any size and type of data, including text.N/A
    Pricing
    IBM SPSS ModelerSAS Visual Analytics
    Editions & Modules
    IBM SPSS Modeler Personal
    4,670
    per year
    IBM SPSS Modeler Professional
    7,000
    per year
    IBM SPSS Modeler Premium
    11,600
    per year
    IBM SPSS Modeler Gold
    contact IBM
    per year
    SAS Visual Analytics for SAS Cloud
    $0
    Annual By Users: 5, 10, 20
    Offerings
    Pricing Offerings
    IBM SPSS ModelerSAS Visual Analytics
    Free Trial
    YesYes
    Free/Freemium Version
    NoNo
    Premium Consulting/Integration Services
    YesYes
    Entry-level Setup FeeOptionalNo setup fee
    Additional DetailsIBM SPSS Modeler Personal enables users to design and build predictive models right from the desktop. IBM SPSS Modeler Professional extends SPSS Modeler Personal with enterprise-scale in-database mining, SQL pushback, collaboration and deployment, champion/challenger, A/B testing, and more. IBM SPSS Modeler Premium extends SPSS Modeler Professional by including unstructured data analysis with integrated, natural language text and entity and social network analytics. IBM SPSS Modeler Gold extends SPSS Modeler Premium with the ability to build and deploy predictive models directly into the business process to aid in decision making. This is achieved with Decision Management which combines predictive analytics with rules, scoring, and optimization to deliver recommended actions at the point of impact.SAS Visual Statistics and SAS Office Analytics are also available as add-ons.
    More Pricing Information
    Community Pulse
    IBM SPSS ModelerSAS Visual Analytics
    Considered Both Products
    IBM
    No answer on this topic
    SAS
    No answer on this topic
    Key User Insights
    Would buy again
    100%
    Would buy again
    5 Answers
    No answers on this topic
    Delivers good value for the price
    No answers on this topic
    No answers on this topic
    Happy with the feature set
    100%
    Happy with the feature set
    5 Answers
    No answers on this topic
    Lived up to sales and marketing promises
    No answers on this topic
    No answers on this topic
    Implementation went as expected
    No answers on this topic
    No answers on this topic
    Features
    IBM SPSS ModelerSAS Visual Analytics
    Platform Connectivity
    Comparison of Platform Connectivity features of IBM SPSS Modeler and SAS Visual Analytics
    Feature
    IBM SPSS Modeler
    8.9
    2 Ratings
    6% above category average
    SAS Visual Analytics
    -
    Ratings
    Connect to Multiple Data Sources8.82 Ratings00 Ratings
    Extend Existing Data Sources8.82 Ratings00 Ratings
    Automatic Data Format Detection9.01 Ratings00 Ratings
    MDM Integration9.01 Ratings00 Ratings
    Data Exploration
    Comparison of Data Exploration features of IBM SPSS Modeler and SAS Visual Analytics
    Feature
    IBM SPSS Modeler
    9.0
    1 Ratings
    7% above category average
    SAS Visual Analytics
    -
    Ratings
    Visualization9.01 Ratings00 Ratings
    Interactive Data Analysis9.01 Ratings00 Ratings
    Data Preparation
    Comparison of Data Preparation features of IBM SPSS Modeler and SAS Visual Analytics
    Feature
    IBM SPSS Modeler
    9.0
    1 Ratings
    10% above category average
    SAS Visual Analytics
    -
    Ratings
    Interactive Data Cleaning and Enrichment9.01 Ratings00 Ratings
    Data Transformations9.01 Ratings00 Ratings
    Data Encryption9.01 Ratings00 Ratings
    Built-in Processors9.01 Ratings00 Ratings
    Platform Data Modeling
    Comparison of Platform Data Modeling features of IBM SPSS Modeler and SAS Visual Analytics
    Feature
    IBM SPSS Modeler
    9.0
    1 Ratings
    6% above category average
    SAS Visual Analytics
    -
    Ratings
    Multiple Model Development Languages and Tools9.01 Ratings00 Ratings
    Automated Machine Learning9.01 Ratings00 Ratings
    Single platform for multiple model development9.01 Ratings00 Ratings
    Self-Service Model Delivery9.01 Ratings00 Ratings
    Model Deployment
    Comparison of Model Deployment features of IBM SPSS Modeler and SAS Visual Analytics
    Feature
    IBM SPSS Modeler
    9.0
    1 Ratings
    6% above category average
    SAS Visual Analytics
    -
    Ratings
    Flexible Model Publishing Options9.01 Ratings00 Ratings
    Security, Governance, and Cost Controls9.01 Ratings00 Ratings
    BI Standard Reporting
    Comparison of BI Standard Reporting features of IBM SPSS Modeler and SAS Visual Analytics
    Feature
    IBM SPSS Modeler
    -
    Ratings
    SAS Visual Analytics
    8.3
    11 Ratings
    2% above category average
    Pixel Perfect reports00 Ratings8.011 Ratings
    Customizable dashboards00 Ratings8.011 Ratings
    Report Formatting Templates00 Ratings9.010 Ratings
    Ad-hoc Reporting
    Comparison of Ad-hoc Reporting features of IBM SPSS Modeler and SAS Visual Analytics
    Feature
    IBM SPSS Modeler
    -
    Ratings
    SAS Visual Analytics
    8.8
    12 Ratings
    9% above category average
    Drill-down analysis00 Ratings9.012 Ratings
    Formatting capabilities00 Ratings8.012 Ratings
    Integration with R or other statistical packages00 Ratings8.010 Ratings
    Report sharing and collaboration00 Ratings10.011 Ratings
    Report Output and Scheduling
    Comparison of Report Output and Scheduling features of IBM SPSS Modeler and SAS Visual Analytics
    Feature
    IBM SPSS Modeler
    -
    Ratings
    SAS Visual Analytics
    9.2
    12 Ratings
    11% above category average
    Publish to Web00 Ratings9.011 Ratings
    Publish to PDF00 Ratings9.012 Ratings
    Report Versioning00 Ratings9.09 Ratings
    Report Delivery Scheduling00 Ratings10.011 Ratings
    Delivery to Remote Servers00 Ratings9.06 Ratings
    Data Discovery and Visualization
    Comparison of Data Discovery and Visualization features of IBM SPSS Modeler and SAS Visual Analytics
    Feature
    IBM SPSS Modeler
    -
    Ratings
    SAS Visual Analytics
    9.7
    10 Ratings
    19% above category average
    Pre-built visualization formats (heatmaps, scatter plots etc.)00 Ratings10.09 Ratings
    Location Analytics / Geographic Visualization00 Ratings10.010 Ratings
    Predictive Analytics00 Ratings9.09 Ratings
    Access Control and Security
    Comparison of Access Control and Security features of IBM SPSS Modeler and SAS Visual Analytics
    Feature
    IBM SPSS Modeler
    -
    Ratings
    SAS Visual Analytics
    8.3
    11 Ratings
    2% below category average
    Multi-User Support (named login)00 Ratings9.011 Ratings
    Role-Based Security Model00 Ratings8.010 Ratings
    Multiple Access Permission Levels (Create, Read, Delete)00 Ratings8.011 Ratings
    Single Sign-On (SSO)00 Ratings8.07 Ratings
    Mobile Capabilities
    Comparison of Mobile Capabilities features of IBM SPSS Modeler and SAS Visual Analytics
    Feature
    IBM SPSS Modeler
    -
    Ratings
    SAS Visual Analytics
    8.7
    9 Ratings
    11% above category average
    Responsive Design for Web Access00 Ratings10.09 Ratings
    Mobile Application00 Ratings9.07 Ratings
    Dashboard / Report / Visualization Interactivity on Mobile00 Ratings9.08 Ratings
    Application Program Interfaces (APIs) / Embedding
    Comparison of Application Program Interfaces (APIs) / Embedding features of IBM SPSS Modeler and SAS Visual Analytics
    Feature
    IBM SPSS Modeler
    -
    Ratings
    SAS Visual Analytics
    9.2
    5 Ratings
    17% above category average
    REST API00 Ratings10.04 Ratings
    Javascript API00 Ratings9.04 Ratings
    iFrames00 Ratings9.04 Ratings
    Java API00 Ratings9.04 Ratings
    Themeable User Interface (UI)00 Ratings9.04 Ratings
    Customizable Platform (Open Source)00 Ratings9.03 Ratings
    Best Alternatives
    IBM SPSS ModelerSAS Visual Analytics
    Small Businesses
    RapidMiner
    Score8.9 out of 10
    Cyfe
    Score4 out of 10
    Medium-sized Companies
    Anaconda
    Score8.8 out of 10
    Qlik Cloud Analytics (Qlik Sense)
    Score8.1 out of 10
    Enterprises
    IBM Watson Studio
    Score10 out of 10
    Sisense
    Score6.9 out of 10
    All AlternativesView all alternativesView all alternatives
    User Ratings
    IBM SPSS ModelerSAS Visual Analytics
    Likelihood to Recommend
    9.7
    (8 ratings)
    9.0
    (17 ratings)
    Likelihood to Renew
    -
    (0 ratings)
    9.3
    (3 ratings)
    Usability
    8.9
    (2 ratings)
    6.0
    (1 ratings)
    Support Rating
    10.0
    (1 ratings)
    8.0
    (3 ratings)
    Data Sharing and Collaboration
    -
    (0 ratings)
    9.6
    (11 ratings)
    Data Sources
    -
    (0 ratings)
    9.8
    (11 ratings)
    User Testimonials
    IBM SPSS ModelerSAS Visual Analytics
    Likelihood to Recommend
    IBM
    Fast NLP analytics are very easy in SPSS Modeler because there is a built-in interface for classifying concepts and themes and several pre-built models to match the incoming text source. The visualizations all match and help present NLP information without substantial coding, typically required for word clouds and such. SPSS Modeler is good at attaining results faster in general, and the visual nature of the code makes a good tool to have in the data science team's repository. For younger data scientists, and those just interested, it is a good tool to allow for exploring data science techniques.
    Incentivized
    Read full review
    SAS
    I was in a meeting with the client and there I have to show them some analytic data to them. But I was confused about how I will manage to show big data to clients with accuracy. But then the SAS Visual Analytics software helps me in presenting accurate data at the moment and it was very presentable and through that, I got the deal for that business.
    Incentivized
    Read full review
    Pros
    IBM
    • Combine text and data
    • Provide facilities for all phases of the data mining process.
    • Use a node and stream paradigm to easily and quickly create models.
    Incentivized
    Read full review
    SAS
    • Provides the flexibility to the end user to slice and dice the data.
    • Anyone can make predictive models with the help of in-built algorithms without the need to write a single line of code or knowledge of what's under the hood of algorithms.
    • The feature to simply ask a question related to data and getting a response in form of text, chart or graph is amazing.
    Incentivized
    Read full review
    Cons
    IBM
    • Has very old style graphs, with lots of limitations.
    • Some advanced statistical functions cannot be done through the menu.
    • The data connectivity is not that extensive.
    • It's an expensive tool.
    Incentivized
    Read full review
    SAS
    • SAS is relatively expensive when compared to other BI tools and requires a large amount of upfront fee which becomes an issue for smaller organizations.
    • UI for the dashboards looks a little date in comparison to competitors like Tableau and Microstrategy.
    • Integration with other open source software like Python needs to be built in.
    Incentivized
    Read full review
    Likelihood to Renew
    IBM
    No answers on this topic
    SAS
    SAS really is the cutting edge in Business Intelligence. That is all they do! They are constantly coming out with new products, product upgrades, and their tech support is second to none. In addition, their support of Education has made our ability to acquire their product possible.
    Read full review
    Usability
    IBM
    The ability to do predictive modeling, text analytics for both structured & unstructured data, decision management, optimization, and support for various data sources
    Incentivized
    Read full review
    SAS
    SAS BI is good for creating reports and dashboards and then sharing it with the users. It also has ability to manage access to the reports and dashboards but somehow with most of the world moving to open source languages R, Python and Julia, SAS BI feels to be archaic in terms of feature set and integrations it allow[s]. Also, comparing it with other Business Intelligence tools like Tableau and Microsoft BI, the functionality of SAS BI is very limited and doesn't justify the pricing.
    Incentivized
    Read full review
    Support Rating
    IBM
    The online support board is helpful and the free add ons are incredibly appreciated.
    Incentivized
    Read full review
    SAS
    When you call tech support, you are immediately routed to a person who can answer your question. Often they can answer on the spot. However, if they cannot, you are given a track number and then followed up with. There have been times when I have had multiple track numbers open and they will actually TRACK YOU DOWN to ensure that your problem has been resolved. Issues do not fall into black holes with SAS. They are also willing to do a WebEx with you to diagnose the problem by seeing your environment, which is always helpful.
    Read full review
    Alternatives Considered
    IBM
    When it comes to investigation and descriptive we have found SPSS Statistics to be the tool of choice, but when it comes to projects with large and several datasets SPSS Modeler has been picked from our customers.
    Incentivized
    Read full review
    SAS
    I have used Crystal Reports, Jaspersoft and SQL Server Reporting Services (SSRS). I would recommended Business Intelligence over SSRS and Crystal Reports. SSRS is very SQL-centric and Crystal Reports is more of an end-user tool. I would recommend Jaspersoft over Business Intelligence for developing a seamless web-based reporting interface but I highly recommend Business Intelligence for end-user ad-hoc reporting.
    Incentivized
    Read full review
    Return on Investment
    IBM
    • Positive - Ease of decision making and reduction in product life cycle time.
    • Positive - Gives entirely new perspective with the help of right team. Helps expanding the portfolio.
    • Negative - Needs to have good understanding about mathematical modelling, of which talent is rare and expensive. Hence, increase the costs for R&D and manpower.
    Incentivized
    Read full review
    SAS
    • SAS Visual Analytics licensing cost should be reduced to enable users to use it in mass scale.
    • More statistical and mathematical equations and theories should be converted into SAS functions for reusing.
    • Because of enriched ETL and reporting capabilities SAS Visual Analytics is most preferred by business users.
    Incentivized
    Read full review
    ScreenShots

    IBM SPSS Modeler Screenshots

    Screenshot of Use a single run to test multiple modeling methods, compare results and select which model to deploy. Quickly choose the best performing algorithm based on model performance.Screenshot of Explore geographic data, such as latitude and longitude, postal codes and addresses. Combine it with current and historical data for better insights and predictive accuracy.Screenshot of Capture key concepts, themes, sentiments and trends by analyzing unstructured text data. Uncover insights in web activity, blog content, customer feedback, emails and social media comments.Screenshot of Use R, Python, Spark, Hadoop and other open source technologies to amplify the power of your analytics. Extend and complement these technologies for more advanced analytics while you keep control.

    SAS Visual Analytics Screenshots

    Screenshot of Explore your data using analytics and interactive data visualizations.