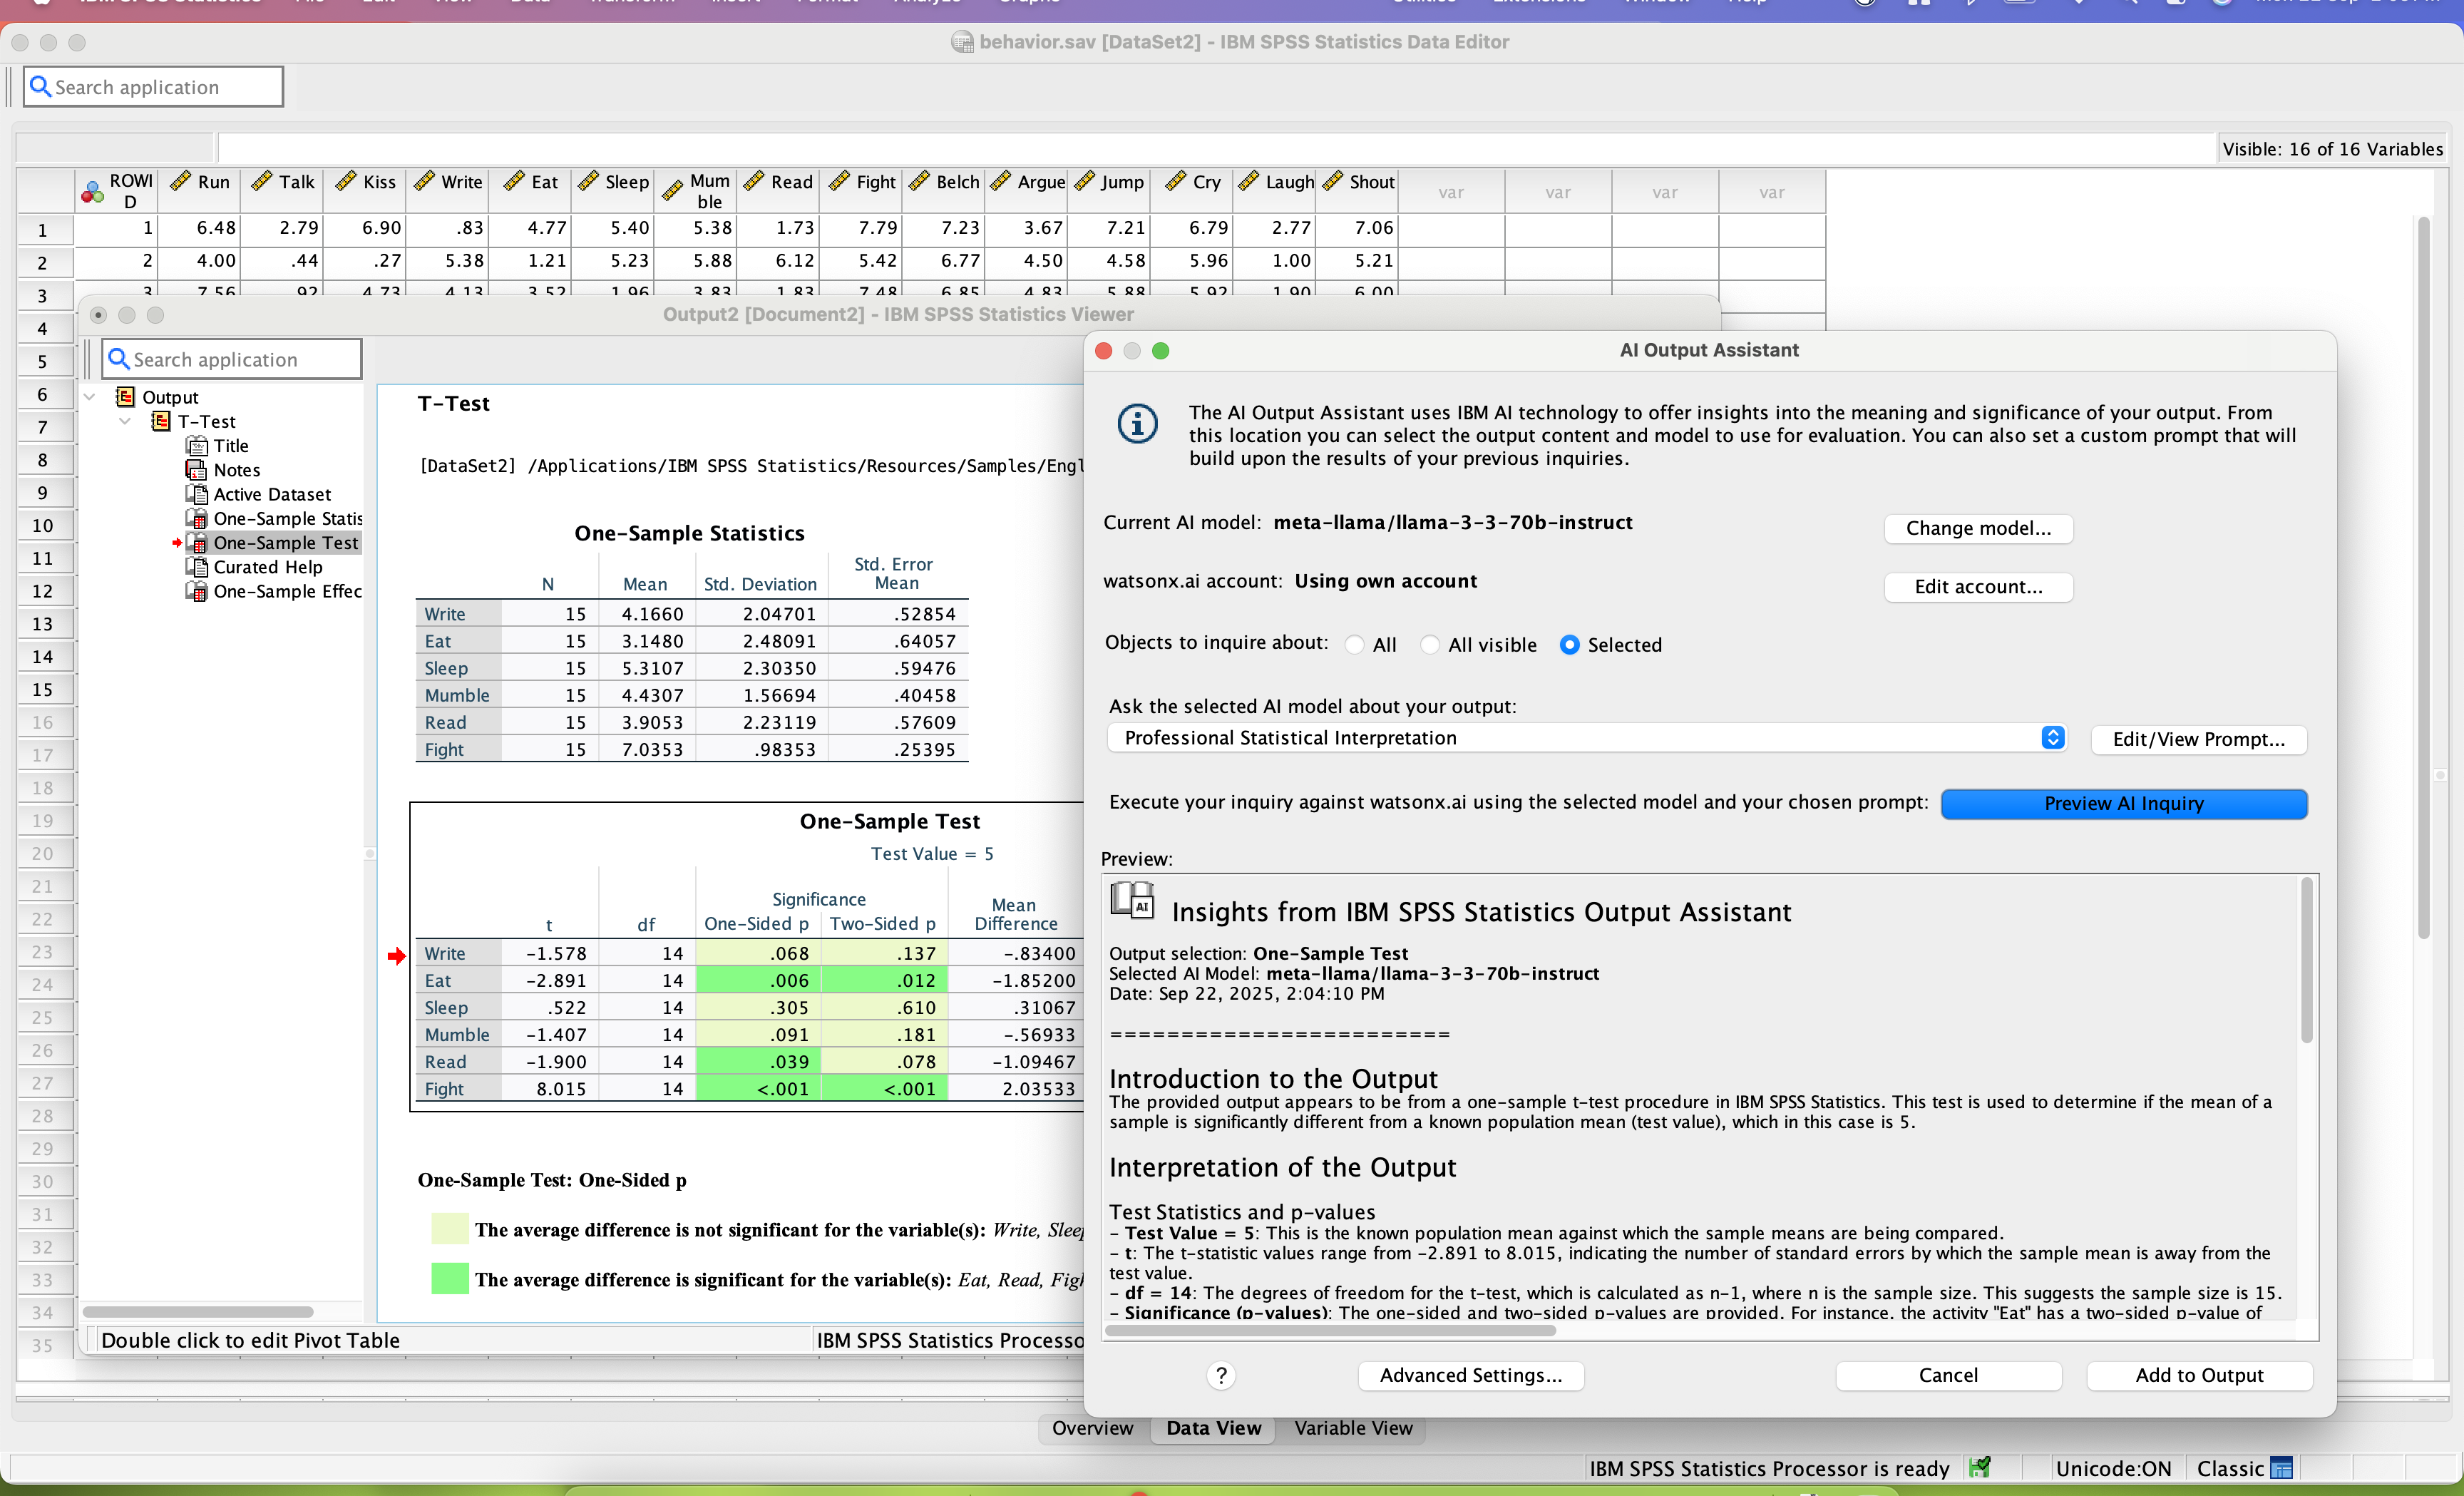
SPSS Statistics is a software package used for statistical analysis. It is now officially named "IBM SPSS Statistics". Companion products in the same family are used for survey authoring and deployment (IBM SPSS Data Collection), data mining (IBM SPSS Modeler), text analytics, and collaboration and deployment (batch and automated scoring services).
$105
per month per user
Klipfolio Klips
Score6 out of 10
Small Businesses (1-50 employees)
Klipfolio is a customizable dashboard and reporting platform that provides real-time business insights. It is used by small to mid-sized businesses and agencies to track performance metrics and create tailored reports, and to consolidate, transform, and visualize data.
$90
per month
Pricing
IBM SPSS Statistics
Klipfolio Klips
Editions & Modules
Base
USD 3,830
one-time fee per user
Standard
USD 8,440
one-time fee per user
Professional
USD 16,900
one-time fee per user
Premium
USD 25,200
one-time fee per user
Monthly subscription
USD 105
per month per user
Annual subscription
USD 1,188.00
per year per user
Base
$90
per month
Grow
$190
per month
Team
$350
per month
Offerings
Pricing Offerings
IBM SPSS Statistics
Klipfolio Klips
Free Trial
Yes
Yes
Free/Freemium Version
No
No
Premium Consulting/Integration Services
No
Yes
Entry-level Setup Fee
No setup fee
Optional
Additional Details
—
Discount available for annual pricing. There are various implementation and training options available, from a 60 Day Proof of Concept, to Onboarding & Training, or ongoing dedicated Data Hero support.
IBM SPSS Statistics is well suited for pretty much any data analytic scenario. It can handle extremely complex and large-scale datasets with ease. It especially shines if you have to do any kind of analyses that involve significance testing. Being able to do any number of significance tests (i.e., t-tests, chi-square, ANOVAs, etc.) right inside the tool is very valuable. The only scenario I would say it is less appropriate is if you need to work on a very small dataset and answer very simple questions, like frequencies or averages. In those cases, something like Excel could probably do the job just as easily.
A de minimis incentive was given to thank the reviewer for their time. The incentive was not used to bias or drive a particular response, nor was the incentive contingent on a positive endorsement. TR verified that a representative sample of customers was invited. More Info
Using Klipfolio is one of the finest ways we can expand our business because it is so simple to use and always has new features that make it better. We also appreciate the excellent customer service they offer. There are several benefits to making this investment in your company's efficiency and profitability. We think it's worth the money.
A de minimis incentive was given to thank the reviewer for their time. The incentive was not used to bias or drive a particular response, nor was the incentive contingent on a positive endorsement. More Info
SPSS has been around for quite a while and has amassed a large suite of functionality. One of its longest-running features is the ability to automate SPSS via scripting, AKA "syntax." There is a very large community of practice on the internet who can help newbies to quickly scale up their automation abilities with SPSS. And SPSS allows users to save syntax scripting directly from GUI wizards and configuration windows, which can be a real life-saver if one is not an experienced coder.
Many statistics package users are doing scientific research with an eye to publish reproducible results. SPSS allows you to save datasets and syntax scripting in a common format, facilitating attempts by peer reviewers and other researchers to quickly and easily attempt to reproduce your results. It's very portable!
SPSS has both legacy and modern visualization suites baked into the base software, giving users an easily mountable learning curve when it comes to outputting charts and graphs. It's very easy to start with a canned look and feel of an exported chart, and then you can tweak a saved copy to change just about everything, from colors, legends, and axis scaling, to orientation, labels, and grid lines. And when you've got a chart or graph set up the way you like, you can export it as an image file, or create a template syntax to apply to new visualizations going forward.
SPSS makes it easy for even beginner-level users to create statistical coding fields to support multidimensional analysis, ensuring that you never need to destructively modify your dataset.
In closing, SPSS's long and successful tenure ensures that just about any question a new user may have about it can be answered with a modicum of Google-fu. There are even several fully-fledged tutorial websites out there for newbie perusal.
A de minimis incentive was given to thank the reviewer for their time. The incentive was not used to bias or drive a particular response, nor was the incentive contingent on a positive endorsement. More Info
A de minimis incentive was given to thank the reviewer for their time. The incentive was not used to bias or drive a particular response, nor was the incentive contingent on a positive endorsement. More Info
Availability of procedures in the base package seems to be dwindling.
The copy-and-paste function from output to Excel is not as easy as it once was (now I have to do a "paste special").
Text and date handling are terrible.
Need to include AI-based NLP for survey verbatims and other text-based fields. This is becoming increasingly important in the CX world, yet SPSS seems to be ignoring it.
A de minimis incentive was given to thank the reviewer for their time. The incentive was not used to bias or drive a particular response, nor was the incentive contingent on a positive endorsement. More Info
While Klipfolio covers so many of the bases, one area where I would like to see expansion would be offering additional design and graphics themes for even more customization.
Klipfolio has an extensive offering but might be even better if there were a way that we could integrate with some small to mid-sized CRM solutions for audience list segmentation and marketing integrations.
It would be interesting if Klipfolio could enable us to overlay the data learnings for cross-referencing of multiple client campaigns for comparative insights.
A de minimis incentive was given to thank the reviewer for their time. The incentive was not used to bias or drive a particular response, nor was the incentive contingent on a positive endorsement. More Info
Both money and time are essential for success in terms of return on investment for any kind of research based project work. Using a Likert-scale questionnaire is very easy for data entry and analysis using IBM SPSS. With the help of IBM SPSS, I found very fast and reliable data entry and data analysis for my research. Output from SPSS is very easy to interpret for data analysis and findings
A de minimis incentive was given to thank the reviewer for their time. The incentive was not used to bias or drive a particular response, nor was the incentive contingent on a positive endorsement. More Info
Probably because I have been using it for so long that I have used all of the modules, or at least almost all of the modules, and the way SPSS works is second nature to me, like fish to swimming.
A de minimis incentive was given to thank the reviewer for their time. The incentive was not used to bias or drive a particular response, nor was the incentive contingent on a positive endorsement. More Info
My initial impressions of the software have been extremely positive. There are YouTube tutorials that explain how to make klips. The intuitive design of the UI It appears that everything in this software has been thoroughly tested to create all the visualizations that can be imagined as well as the user input controls that allow users to have exactly the data they want to be displayed in seconds, considering the various functions and formulas available in the Excel integrations and the extensive list of other services that can be integrated.
A de minimis incentive was given to thank the reviewer for their time. The incentive was not used to bias or drive a particular response, nor was the incentive contingent on a positive endorsement. More Info
A de minimis incentive was given to thank the reviewer for their time. The incentive was not used to bias or drive a particular response, nor was the incentive contingent on a positive endorsement. More Info
A de minimis incentive was given to thank the reviewer for their time. The incentive was not used to bias or drive a particular response, nor was the incentive contingent on a positive endorsement. More Info
I have not contacted IBM SPSS for support myself. However, our IT staff has for trying to get SPSS Text Analytics Module to work. The issue was never resolved, but I'm not sure if it was on the IT's end or on SPSS's end
It provides all the necessary information to be able to carry out the analysis of any type of business, to know how money is managed virtually, what to do to have greater visibility, in addition to being a platform that is always accessible and allows continuous and efficient work.
A de minimis incentive was given to thank the reviewer for their time. The incentive was not used to bias or drive a particular response, nor was the incentive contingent on a positive endorsement. More Info
Have a plan for managing the yearly upgrade cycle. Most users work in the desktop version, so there needs to be a mechanism for either pushing out new versions of the software or a key manager to deal with updated licensing keys. If you have a lot of users this needs to be planned for in advance.
A de minimis incentive was given to thank the reviewer for their time. The incentive was not used to bias or drive a particular response, nor was the incentive contingent on a positive endorsement. More Info
If you have made it this far, you should have a very good idea of how SPSS stacks up the competition (data processing and analytics tools). Even the free ones, such as r Studio or Stata, are leaps and bounds ahead of SPSS. IBM is resting on a reputation developed nearly 30 years ago and has shown no desire to improve.
A de minimis incentive was given to thank the reviewer for their time. The incentive was not used to bias or drive a particular response, nor was the incentive contingent on a positive endorsement. TR verified that a representative sample of customers was invited. More Info
These and many other BI tools are the most direct competitors. I only have experience with Klipfolio and Tableau. Tableau is definitely more capable, but much more difficult to learn and use. Klipfolio is simple and really packs a punch for its simplicity. I have yet to run into a major problem with it lacking a needed functionality.
A de minimis incentive was given to thank the reviewer for their time. The incentive was not used to bias or drive a particular response, nor was the incentive contingent on a positive endorsement. More Info
A de minimis incentive was given to thank the reviewer for their time. The incentive was not used to bias or drive a particular response, nor was the incentive contingent on a positive endorsement. More Info
I found SPSS easier to use than SAS as it's more intuitive to me.
The learning curve to use SPSS is less compared to SAS.
I used SAS, to a much lesser extent than SPSS. However, it seems that SAS may be more suitable for users who understand programming. With SPSS, users can perform many statistical tests without the need to know programming.
A de minimis incentive was given to thank the reviewer for their time. The incentive was not used to bias or drive a particular response, nor was the incentive contingent on a positive endorsement. TR verified that a representative sample of customers was invited. More Info