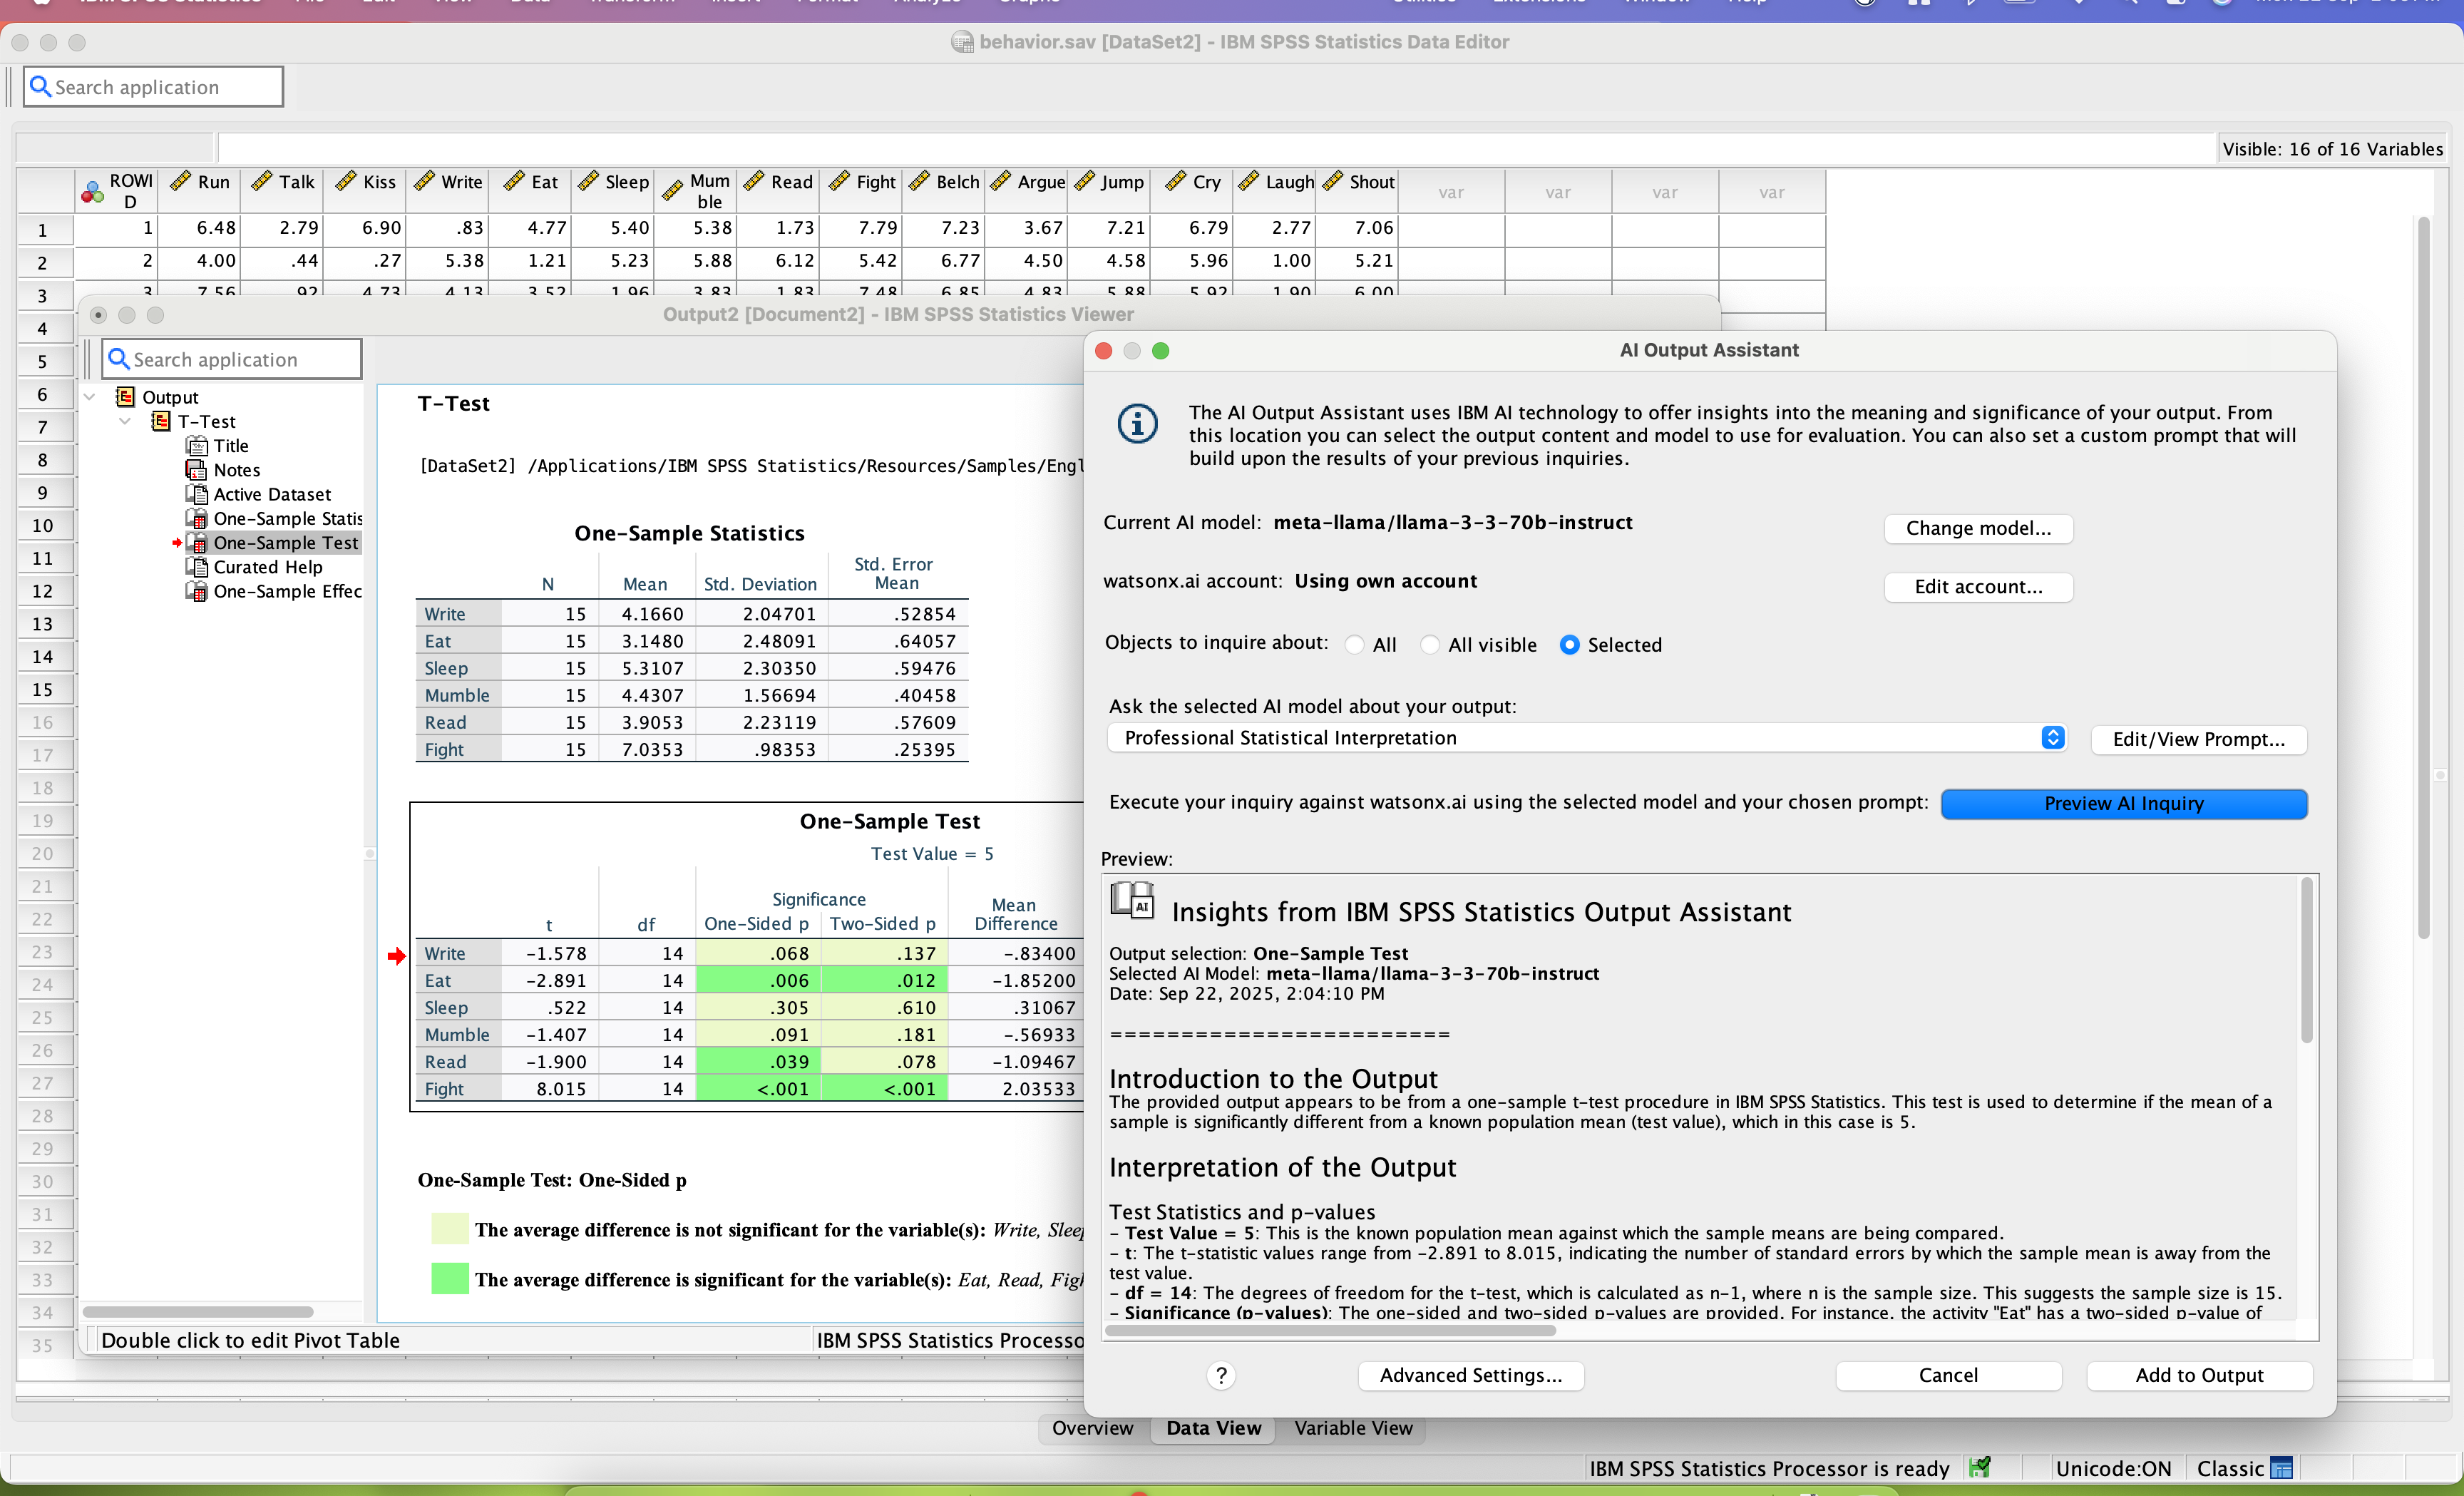
SPSS Statistics is a software package used for statistical analysis. It is now officially named "IBM SPSS Statistics". Companion products in the same family are used for survey authoring and deployment (IBM SPSS Data Collection), data mining (IBM SPSS Modeler), text analytics, and collaboration and deployment (batch and automated scoring services).
$105
per month per user
SAS Viya
Score 10.0 out of 10
N/A
An end-to-end platform for AI, data science, and analytics, used for modeling, as well as management and deployment of AI models.
SAS is a very good product. SPSS provided our firm everythinbg we needed and was well within our budget. Also know that IBM is contunusely investing into SPSS. The roadmaps looks good.
[IBM] SPSS is by far the best of the statistics software applications in terms of functionality and accessibility, but its biggest drawback is price. SPSS is prohibitively expensive in comparison to the other competing statistics applications such as R and SAS, making the …
SPSS is easier to navigate, more visually intuitive, and more user-friendly. It might not handle the volume of data that SAS can handle. But 99% of the projects I would be involved with, SPSS handles with flying colors.
JMP is user-friendly like SPSS but is more limited in terms of data analyses.
SAS is better for managing and modifying large datasets. SAS also provides more customization for analyzing things like group differences. However, SAS does not handle modifying string responses well. …
SAS has a greater number of functions than SPSS but most of the times they are not required. Also, the user interface is very complicated in SAS as compared to SPSS. The only advantage SAS has is more product recognition.
MATLAB is far more powerful at modeling massive data sets and allows for further individualizations that are often needed at research. MATLAB can also analyze pictures and run analysis on them. However SPSS is very good for what it is meant for.
SAS is faster then both SPSS and STATA. SAS also has better models and graphs when comparing the three softwares. However, STATA and SPSS are more user friendly. It is easy to use SPSS and STATA, because a lot of it is point-click. SAS requires some training to be able to use …
IBM SPSS and SAS Advanced Analytics are powerful data science platforms used to conduct statistical analysis of data sets. The main difference between the two tools is SAS Advanced Analytics uses its own programming language and IBM SPSS runs on Java, and doesn’t require programming to use.
SAS Advanced Analytics is a widely used statistical tool that uses the SAS programming language to analyze data and create visualizations. IBM SPSS is used for statistical analysis and has features that make it easier for individuals without coding knowledge to analyze large datasets.
Both IBM SPSS and SAS Advanced Analytics are most popular with large companies and in higher education due to their high costs.
Features
IBM SPSS and SAS Advanced Analytics offer robust statistical abilities but have key features that may make them more appealing to certain customers.
A key feature of IBM SPSS is that it offers better out of the box capabilities with less setup and downloading of packages. This program offers a minimal learning curve due to its more accessible graphical user interface and the ability to run scripts without extensive coding knowledge. Another advantage of IBM SPSS is that it offers built-in data scrubbing and staging capabilities.
SAS Advanced Analytics’ main feature is that it is capable of using the SAS coding language. Businesses that have users who are familiar with SAS codes can utilize this to make the tool even more powerful. SAS was developed with extremely large datasets in mind and can be the better choice for industries with unusually large amounts of data. Users also speak highly of the support given by SAS if they had system errors or were unable to complete tasks.
Limitations
While both SAS Advanced Analytics and IBM SPSS are both excellent data analysis tools, both exhibit some shortcomings depending on a customer’s use case.
IBM SPSS users have mentioned that visualizations and output graphics could be of a higher quality and may need to be exported to other programs to make them look presentation ready. Users have also complained about performance or installation issues when using Mac products.
SAS Advanced Analytics requires more coding knowledge than SPSS to take full advantage of the tool. Many users have also reported slow performance, but particularly slow startup speeds which means they must commit their machine to run the program. SAS Advanced Analytics is also not available to Mac users.
A major disadvantage of both IBM SPSS and SAS in the analytics space is that they are very expensive compared to some of their newer competition. This can make them less appealing to individuals or small businesses.
Pricing
IBM SPSS can be purchased in two ways. A per month subscription model to the base level software can be purchased for $99.00 per user per month. This tier includes desktop-only capability. 3 additional expansion modules can be added to this tier for an extra cost of $79.00 each. Prices for perpetual term licenses for the Base, Standard, Professional, and Premium packages can be obtained by contacting the vendor. This tier includes access to server-based analytics and cloud storage.
SAS Advanced Analytics pricing can be acquired by request from the vendor.
IBM SPSS Statistics is well suited for pretty much any data analytic scenario. It can handle extremely complex and large-scale datasets with ease. It especially shines if you have to do any kind of analyses that involve significance testing. Being able to do any number of significance tests (i.e., t-tests, chi-square, ANOVAs, etc.) right inside the tool is very valuable. The only scenario I would say it is less appropriate is if you need to work on a very small dataset and answer very simple questions, like frequencies or averages. In those cases, something like Excel could probably do the job just as easily.
SAS Advance Analytics is well suited for data that is visual. Data where you want to see multiple graphs and models are good for this software. However, if your data is more descriptive this may not be the best program. SAS is well suited for data where you need to make comparisons on the feasibility of two different programs. Data that can be compared is perfect for this software.
SPSS has been around for quite a while and has amassed a large suite of functionality. One of its longest-running features is the ability to automate SPSS via scripting, AKA "syntax." There is a very large community of practice on the internet who can help newbies to quickly scale up their automation abilities with SPSS. And SPSS allows users to save syntax scripting directly from GUI wizards and configuration windows, which can be a real life-saver if one is not an experienced coder.
Many statistics package users are doing scientific research with an eye to publish reproducible results. SPSS allows you to save datasets and syntax scripting in a common format, facilitating attempts by peer reviewers and other researchers to quickly and easily attempt to reproduce your results. It's very portable!
SPSS has both legacy and modern visualization suites baked into the base software, giving users an easily mountable learning curve when it comes to outputting charts and graphs. It's very easy to start with a canned look and feel of an exported chart, and then you can tweak a saved copy to change just about everything, from colors, legends, and axis scaling, to orientation, labels, and grid lines. And when you've got a chart or graph set up the way you like, you can export it as an image file, or create a template syntax to apply to new visualizations going forward.
SPSS makes it easy for even beginner-level users to create statistical coding fields to support multidimensional analysis, ensuring that you never need to destructively modify your dataset.
In closing, SPSS's long and successful tenure ensures that just about any question a new user may have about it can be answered with a modicum of Google-fu. There are even several fully-fledged tutorial websites out there for newbie perusal.
Availability of procedures in the base package seems to be dwindling.
The copy-and-paste function from output to Excel is not as easy as it once was (now I have to do a "paste special").
Text and date handling are terrible.
Need to include AI-based NLP for survey verbatims and other text-based fields. This is becoming increasingly important in the CX world, yet SPSS seems to be ignoring it.
SAS Analytics does not have very good graphic capabilities. Their advanced graphics packages are expensive, and still not very appealing or intuitive to customize.
SAS Analytics is not as up-to-date when it comes to advanced analytical techniques as R or other open-source analytics packages.
Both money and time are essential for success in terms of return on investment for any kind of research based project work. Using a Likert-scale questionnaire is very easy for data entry and analysis using IBM SPSS. With the help of IBM SPSS, I found very fast and reliable data entry and data analysis for my research. Output from SPSS is very easy to interpret for data analysis and findings
Not only does SAS become easier to use as the user gets more familiar with its capabilities, but the customer service is excellent. Any issues with SAS and their technical team is either contacting the user via email, chat, text, WebEx, or phone. They have power users that have years of experience with SAS there to help with any issue.
Probably because I have been using it for so long that I have used all of the modules, or at least almost all of the modules, and the way SPSS works is second nature to me, like fish to swimming.
If SAS Enterprise Guide is utilized any beginning user will be able to shorten the learning curve. This is allow the user a plethora of basic capabilities until they can utilize coding to expand their needs in manipulating and presenting data. SAS is also dedicated to expanding this environment so it is ever growing.
SAS probably has the most market saturation out of all of the analytics software worldwide. They are in every industry and they are knowledgable about every industry. They are always available to take questions, solve issues, and discuss a company's needs. A company that buys SAS software has a dedicated representative that is there for all of their needs.
Although nothing is perfect, SAS is almost there. The software can handle billions of rows of data without a glitch and runs at a quick pace regardless of what the user wants to perform. SAS products are made to handle data so performance is of their utmost important. The software is created to run things as efficiently as SAS software can to maximize performance.
I have not contacted IBM SPSS for support myself. However, our IT staff has for trying to get SPSS Text Analytics Module to work. The issue was never resolved, but I'm not sure if it was on the IT's end or on SPSS's end
SAS is generally known for good support that's one of the main reasons to justify the cost of having SAS licenses within our organization is knowing that customer support is just a quick phone call away. I've usually had good experiences with the SAS customer support team it's one of the ways in which the company stands out in my view.
SAS has regional and national conferences that are dedicated to expanding users' knowledge of the software and showing them what changes and additions they are making to the software. There are user groups in most of the major cities that also provide multi-day seminars that focus on specific topics for education. If online training isn't the best way for the user, there is ample in-person training available.
There are online videos, live classes, and resource material which makes training very easy to access. However, nothing is circumstantial so applying your training can get tricky if the user is performing complex tasks. When purchasing software, SAS will also allocate education credits so the user(s) can access classes and material online to help expand their knowledge.
Have a plan for managing the yearly upgrade cycle. Most users work in the desktop version, so there needs to be a mechanism for either pushing out new versions of the software or a key manager to deal with updated licensing keys. If you have a lot of users this needs to be planned for in advance.
Ask as many questions you can before the install to understand the process. Since a third party does the installation your company is sort of a passanger and it is easy to get lost in the process. It also helps to have all users and IT support involved in the install to help increase the knowledge as to how SAS runs and what it needs to perform correctly.
If you have made it this far, you should have a very good idea of how SPSS stacks up the competition (data processing and analytics tools). Even the free ones, such as r Studio or Stata, are leaps and bounds ahead of SPSS. IBM is resting on a reputation developed nearly 30 years ago and has shown no desire to improve.
SAS was the incumbent tool, and what the team knew. We did look into using Revolution Analytics enterprise version of R, but the learning curve on that caused us to stick with SAS. In my current position, I've opted for WPS over SAS. I can still leverage my SAS experience, but the price is about 15% of what SAS charges, with extra functionality, such as direct database access. I can supplement WPS with free software, such R for anything that it might be missing.
It all depends on the type of SAS product the user has. Scaleability differs from product to product, and if the user has SAS Office Analytics the scaleability is quite robust. This software will satisfy the majority of the company's analytic needs for years to come. In addition, if SAS is not meeting the users needs the company can easily find SAS solutions that will.
I found SPSS easier to use than SAS as it's more intuitive to me.
The learning curve to use SPSS is less compared to SAS.
I used SAS, to a much lesser extent than SPSS. However, it seems that SAS may be more suitable for users who understand programming. With SPSS, users can perform many statistical tests without the need to know programming.