Icinga vs. SolarWinds Database Performance Monitor

Overview
ProductRatingMost Used ByProduct SummaryStarting Price
Icinga
Score 8.9 out of 10
N/A
Icinga is an open source network monitoring platform. It includes automation, modularized integration packages, and prebuilt alerts and reporting capabilities.N/A
SolarWinds Database Performance Monitor
Score 8.9 out of 10
N/A
VividCortex, acquired by SolarWinds in December 2019, provides database performance monitoring designed to increase system performance, team efficiency, and infrastructure cost savings. The GDPR- and SOC 2-compliant platform offers visibility into major open-source databases—MySQL, PostgreSQL, Amazon Aurora, MongoDB, and Redis—for the engineering team at scale. Industry leaders like Etsy, GitHub, SendGrid, and Yelp rely on Database Performance Monitor for all-query monitoring and drill…N/A
Pricing
IcingaSolarWinds Database Performance Monitor
Editions & Modules
No answers on this topic
Offerings
Pricing Offerings
IcingaSolarWinds Database Performance Monitor
Free Trial
NoYes
Free/Freemium Version
NoNo
Premium Consulting/Integration Services
NoYes
Entry-level Setup FeeNo setup feeNo setup fee
Additional Details
More Pricing Information
Community Pulse
IcingaSolarWinds Database Performance Monitor
Best Alternatives
IcingaSolarWinds Database Performance Monitor
Small Businesses
Auvik
Auvik
Score 8.8 out of 10

No answers on this topic

Medium-sized Companies
Logz.io
Logz.io
Score 8.4 out of 10
Icinga
Icinga
Score 8.9 out of 10
Enterprises
Zabbix
Zabbix
Score 8.5 out of 10
LogicMonitor
LogicMonitor
Score 9.0 out of 10
All AlternativesView all alternativesView all alternatives
User Ratings
IcingaSolarWinds Database Performance Monitor
Likelihood to Recommend
8.0
(7 ratings)
9.0
(2 ratings)
Likelihood to Renew
9.0
(1 ratings)
-
(0 ratings)
Usability
-
(0 ratings)
9.0
(1 ratings)
User Testimonials
IcingaSolarWinds Database Performance Monitor
Likelihood to Recommend
Icinga GmbH
Icinga is a world-class monitoring system. It can be used for most general monitoring situations. It is not a silver bullet, however, and there are instances where domain-specific monitoring systems are necessary. However, the output from those monitoring systems can be funneled into Icinga as a central monitoring and alerting system.
Read full review
SolarWinds
Computing resources consumed by the DB instance, DPA queries & wait time, deadlock conditions, virtual infrastructure resources. The addition of NPM & DPA integration as well as cross-correlation in the identification of issues with the network or server or DB is all stupid-proof. Monitoring is more than just health and resource consumption, it's also performance. DB performance analysis is key to maintaining healthy DB instances.
Read full review
Pros
Icinga GmbH
  • Wealth of community-developed plugins.
  • Stable codebase.
  • Icinga 2 supports distributed monitoring.
  • Very performant, can support tens of thousands of checks per server.
Read full review
SolarWinds
  • Simple to use and very easy to learn.
  • The execution engines run in parallel, can execute any syntax or query.
  • DPN can run all queries for both Oracle and SQL with no additional support.
Read full review
Cons
Icinga GmbH
  • High learning curve, setting up Icinga from scratch can be a bit of a challenge starting out.
  • If the io2db process fails you UI stops updating, which can be very frustrating.
  • There is no simple mechanism for adding new hosts and services through the web UI, it's all very config-file based.
Read full review
SolarWinds
  • The Reporting feature currently doesn't allow customization.
Read full review
Likelihood to Renew
Icinga GmbH
Icinga is a solid solution which does everything it promises. It is backwards compatible with most Nagios instances, making the transition very easy. Once you get the hang of installing new plugins and editing configuration files expanding its monitoring capabilities are easy.
Read full review
SolarWinds
No answers on this topic
Usability
Icinga GmbH
No answers on this topic
SolarWinds
I would say it is a very good tool from overall perspective compared to what I have used till now, still I will give it like 9 just for the sake of the interface and the integration which they should be doing soon with the main module which is SAM , NPM etc.
Read full review
Alternatives Considered
Icinga GmbH
Icinga is better than Nagios because of its nicer user interface. New Relic can monitor CPU/memory and disk usage, but it's more of a performance and application troubleshooting tool rather than monitoring
Read full review
SolarWinds
SolarWinds DPA gives you a very deep analysis and monitoring of the devices which these tools will not give you neither Datadog or ManageEngine. It even gives you job rate , db locks and all other parameters to monitor which we usually do manually by going in to the DB and not from the tools. It also creates a dashboard out of the same.
Read full review
Return on Investment
Icinga GmbH
  • With one check you know which applications are faulty e.g. after an upgrade. Which is big time saver
  • You easily detect outages ion the applications so that your customer ideally does not even realize there was an outage.
  • Detect if the environment does deliver the same result as in the same time as before to detect shortages.
  • Additional information when debugging. Saved us several hours where we could simply point to a database which was slow.
Read full review
SolarWinds
  • What is the cost of a downed DB instance? That's your ROI. DPM lets you see issues before they become critical.
Read full review
ScreenShots

SolarWinds Database Performance Monitor Screenshots

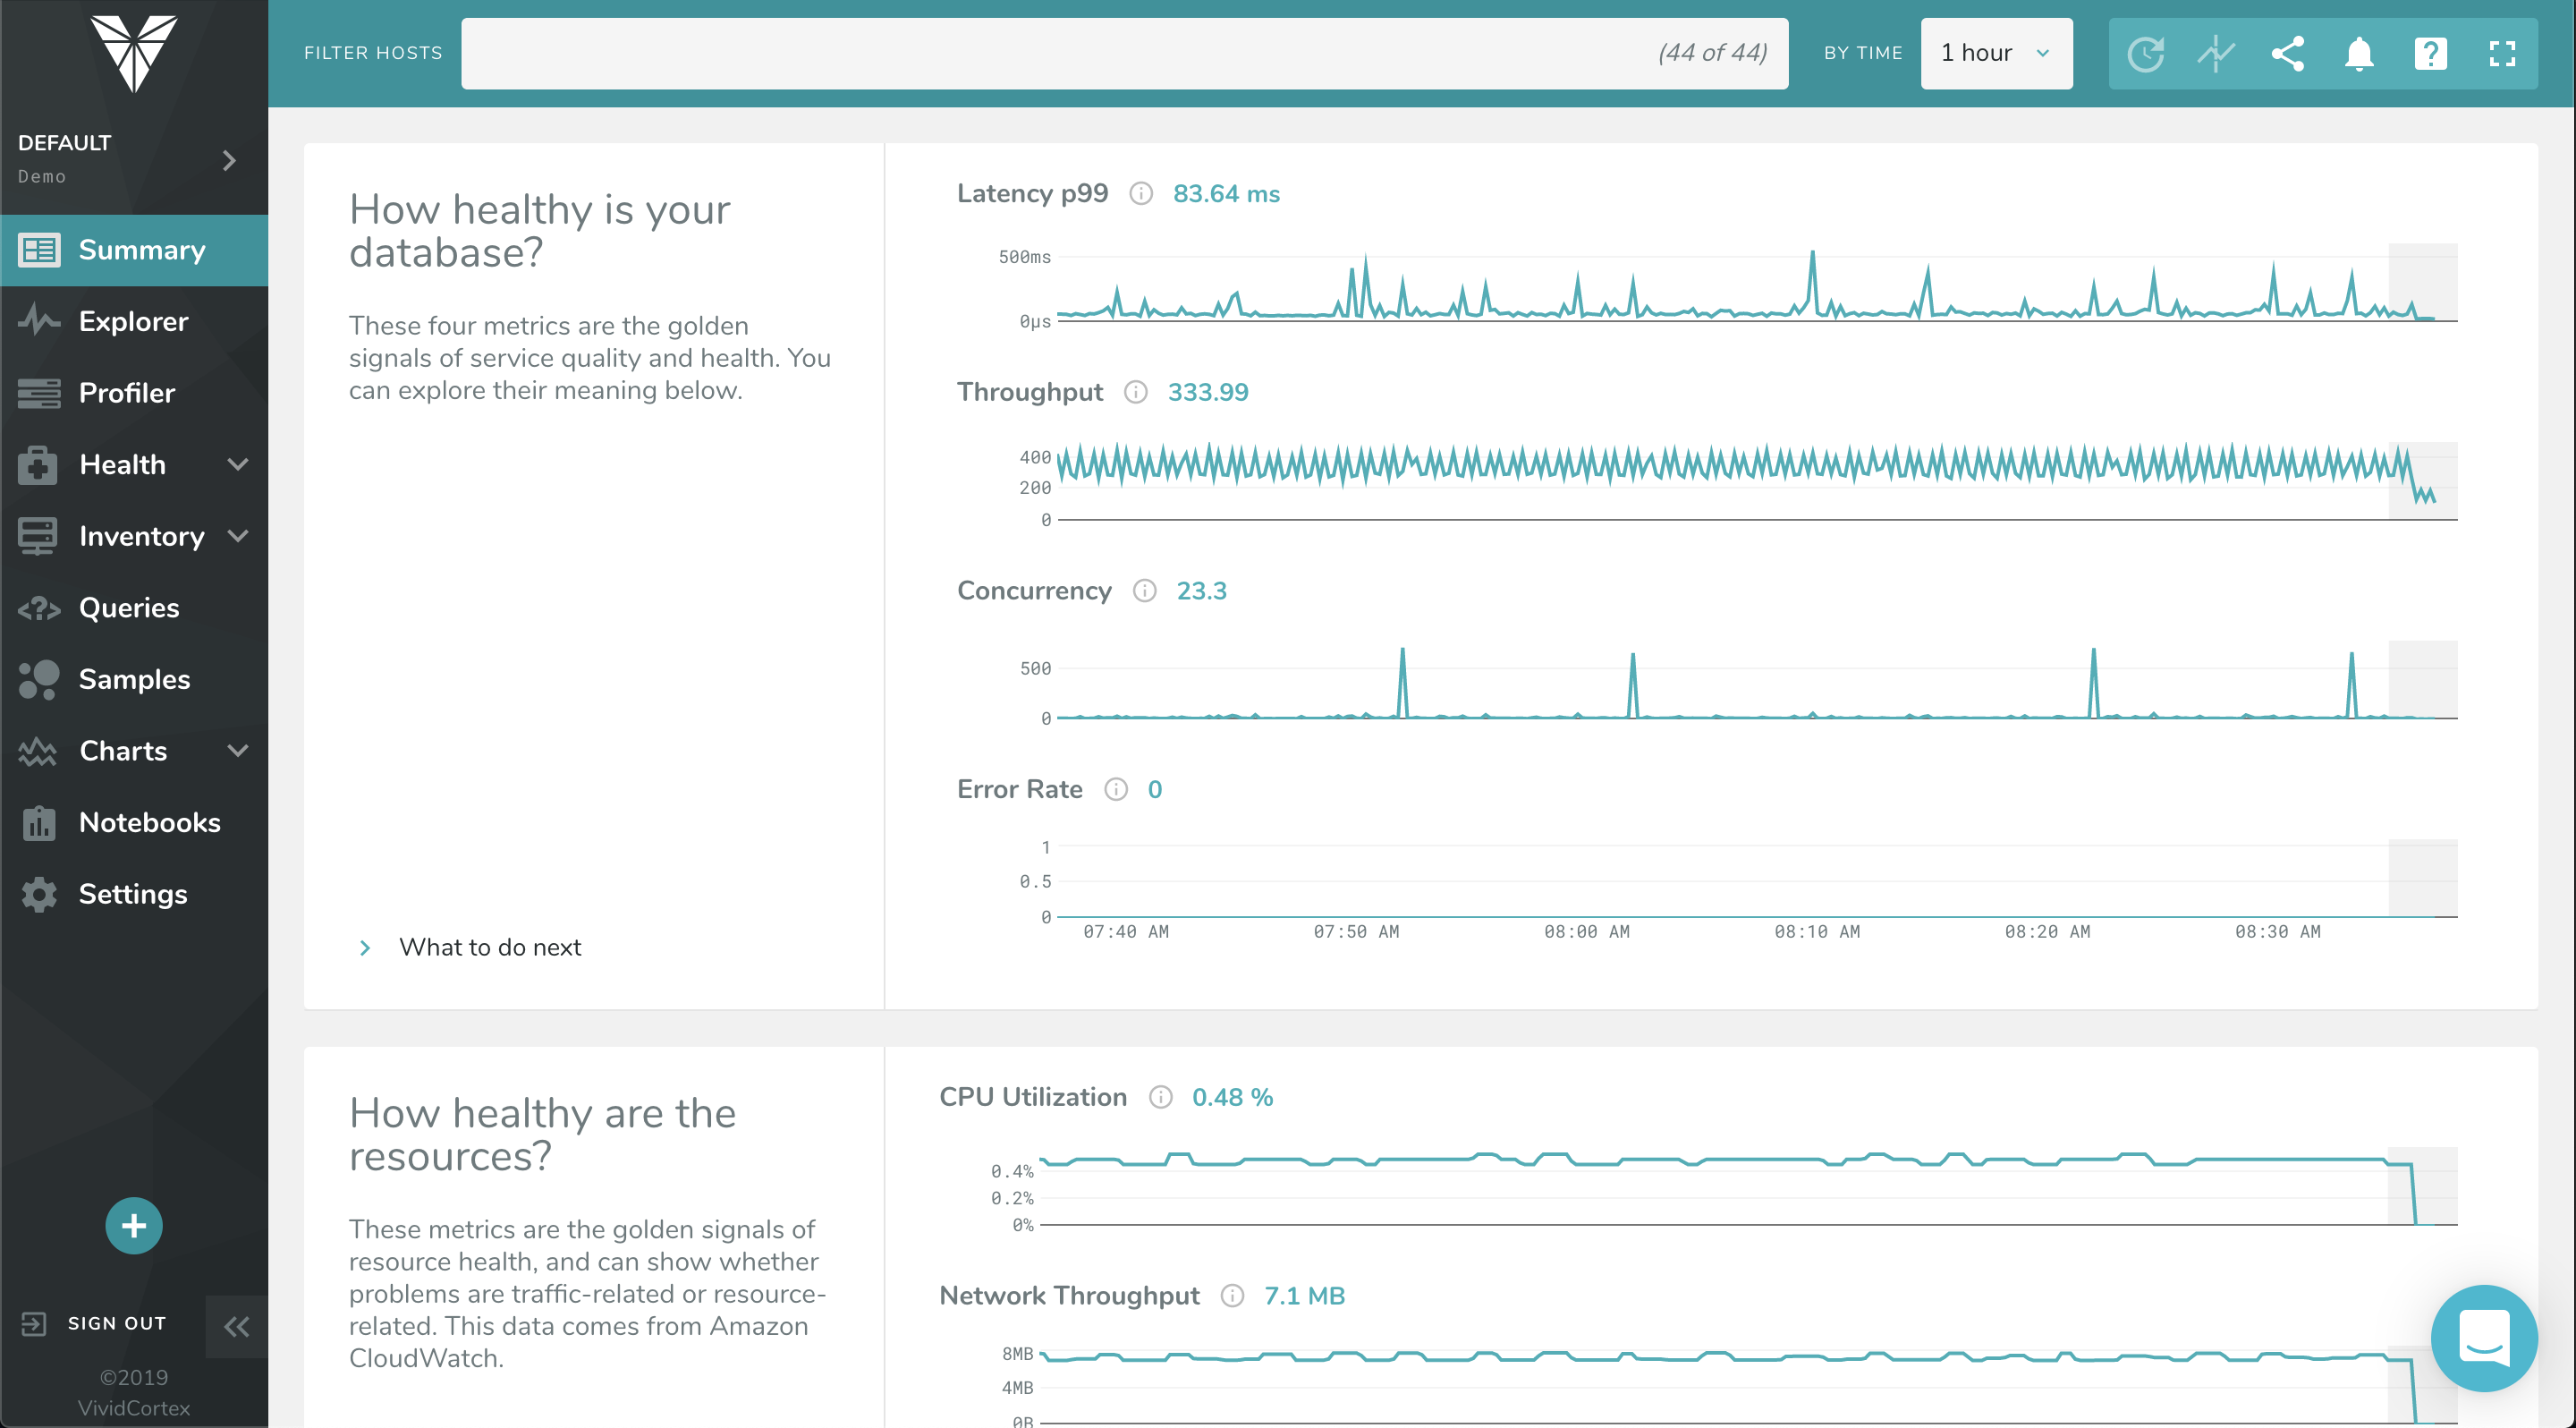
Screenshot of The Profiler Dashboard is a powerful, dynamic dashboard for ranking and filtering activity on your servers: It can instantly show you what needs attention and it provides a unified view of all your database types that VividCortex monitors. It enables you to view and understand your system by profiling it according to its most significant attributes—customized and selected by you.Screenshot of This dashboard displays a list of queries and allows you to filter them with powerful specificity. Filters can be set according to query text, host, and timeframe when the query was first seen / last active.Screenshot of VividCortex captures an enormous amount of data, and the Summary Dashboard helps users make sense of it, reducing their time-to-insight. It features widgets with automatic displays for Top 5 Queries by Total Time, Top 5 Queries by User CPU, Application Overview, Critical Events, and more.Screenshot of VividCortex monitors thousands of metrics in your system, and the Charts and Dashboard’s navigation pane allows you to toggle, customize, and enable various categories of generated charts. You can then easily navigate and examine the charts’ metrics with mouseover and zoom capabilities.