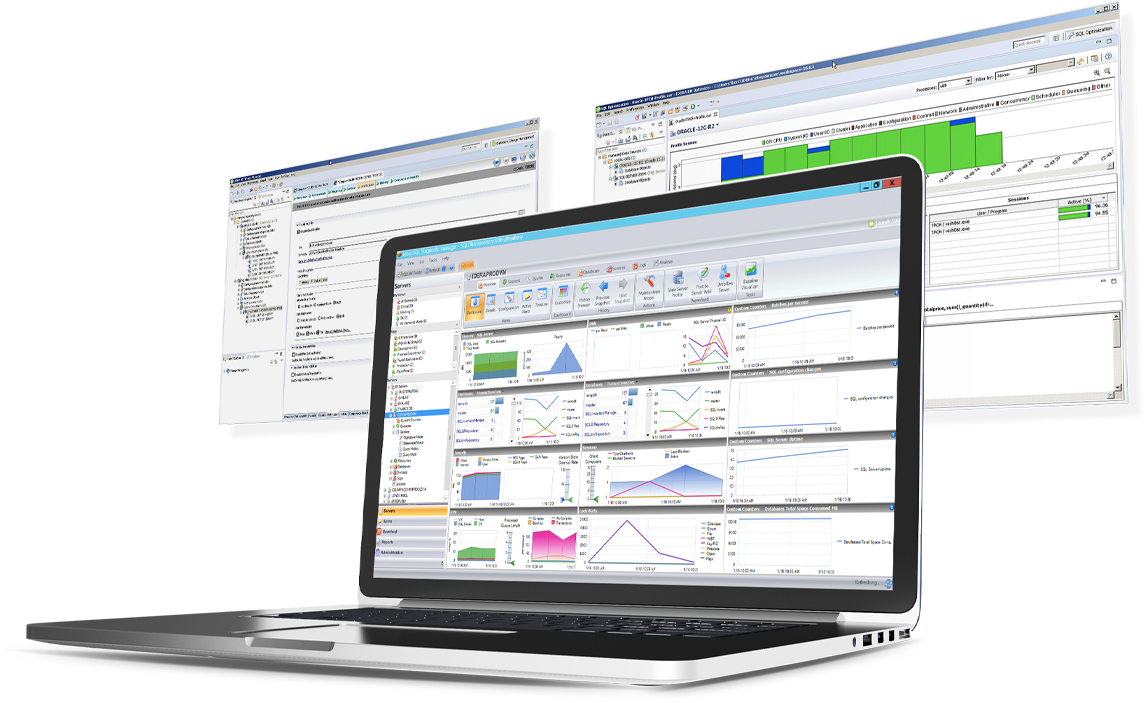
SQL Diagnostic Manager for Microsoft SQL Server helps database administrators to find and fix Microsoft SQL Server performance problems in physical, virtual, and cloud environments. Unlike its competition, it provides effective scalability, advanced SQL query analysis and optimization, prescriptive analysis with corrective SQL scripts, powerful automated alert responses, broad PowerShell integration, complete customization, and extensive support for current and legacy Microsoft SQL Server and…
$1,996
per instance with first year maintenance included
Rackspace Fabric
Score6.3 out of 10
N/A
A solution to bring cloud security, billing, operations and management together. Rackspace Fabric offers a single platform for automated multicloud management. Service includes access to Rackspace cloud technology expertise, and provides a unified interface management for all cloud resources across Azure, AWS, GCP, and VMware, in a single, SaaS like operating environment.
$500
per month
Pricing
IDERA SQL Diagnostic Manager
Rackspace Fabric
Editions & Modules
Standard via eCommerce
1,996.00
per instance with first year maintenance included
Minimum Service
$500.00
per month
Offerings
Pricing Offerings
IDERA SQL Diagnostic Manager
Rackspace Fabric
Free Trial
Yes
No
Free/Freemium Version
No
No
Premium Consulting/Integration Services
No
No
Entry-level Setup Fee
No setup fee
No setup fee
Additional Details
—
—
More Pricing Information
Features
IDERA SQL Diagnostic Manager
Rackspace Fabric
SQL Performance Monitoring
Comparison of SQL Performance Monitoring features of IDERA SQL Diagnostic Manager and Rackspace Fabric
SQL Server [Business Intelligence] Manager is useful for tracking performance across SSIS, SSRS and SSA and have the data represented in dashboards. It helps improve performance and helps end users. However, several features are redundant for smaller organization that can use the tools that comes with existing Microsoft products. These features also takes time to learn and use.
A de minimis incentive was given to thank the reviewer for their time. The incentive was not used to bias or drive a particular response, nor was the incentive contingent on a positive endorsement. More Info
I am highly likely to recommend Rackspace Cloud Monitoring to a colleague. This is assuming they have a decent background in working on cloud servers. If you don't mind digging in yourself to solve problems, then this is a great resource. If you are just learning how to set up servers on your own, then I recommend at least hiring someone to help you use the service. With that being said, Rackspace makes it easy for people you may hire to seamlessly work within your account. They get their own separate developer account.
A de minimis incentive was given to thank the reviewer for their time. The incentive was not used to bias or drive a particular response, nor was the incentive contingent on a positive endorsement. More Info
SQLdm does a good job of providing information at a high level, but also allows me to drill down to specific queries and events if needed. I don't always need to sift through tons of details to get the information I need. It also gives a very wide range of information from SQL specific metrics, to OS metrics, to VM metrics, all the way up to host server metrics.
I like how the alert and notification system can be customized. For example, if you know a certain server regularly has long-running queries, you can adjust the alert to not fire unless a query has been running for 30 minutes while the rest of the servers fire after 30 seconds. That is very helpful in not being bombarded at dinner with alerts from a server similar to, "I've been at 90% cpu for 26 milliseconds!!!!!!!...and now it's back down to 30%" Good information to know, but not something you need to literally lose sleep over.
I like how you can configure different servers to be monitored differently. For example, you can have a group of servers called DEVELOPMENT that you can turn on heavier monitoring on so you can test how changes in applications might affect the SQL environment, but in the PRODUCTION group, you may only want to enable the heavier analysis and logging when performance issues are actively being reported.
A de minimis incentive was given to thank the reviewer for their time. The incentive was not used to bias or drive a particular response, nor was the incentive contingent on a positive endorsement. More Info
Immediate email notifications: In case a service is down on our servers, we get immediate email notifications via rackspace cloud monitoring service. This helps us to know about the issues and we get in contact with support team to get it resolved.
Configuration on specific services: We can configure this monitoring on specific services. So for example if i don't want to get notified if MySQL concurrent users limit reached, then I do not need to configure this monitoring for MySQL. I can just use it whenever needed for defined services.
Group emails and technical contacts emails: The monitoring service can send email alerts to a number of email addresses. Primarily the ones who are added as a technical contact. It helps all people get notified about any issue.
Auto ticket management: Rackspace automatically creates a support ticket when a service is down and is notified by their monitoring service.
A de minimis incentive was given to thank the reviewer for their time. The incentive was not used to bias or drive a particular response, nor was the incentive contingent on a positive endorsement. More Info
Windows client has some issues. When you have small time intervals for your data collection, it can cause the client to become unresponsive and require you to restart it.
It takes more time to get the web client running than it does to get the windows client running.
The visualizations have been the same for the last eight years--could use a little bit of a refresh.
A de minimis incentive was given to thank the reviewer for their time. The incentive was not used to bias or drive a particular response, nor was the incentive contingent on a positive endorsement. More Info
A de minimis incentive was given to thank the reviewer for their time. The incentive was not used to bias or drive a particular response, nor was the incentive contingent on a positive endorsement. More Info
IDERA SQL Diagnostic Manager for SQL, Redgate SQL, and MonitorLogicMonitor are similar products to each other. We decided on IDERA SQL Diagnostic Manager for SQL because our experience with locating heavy queries has been very good and it provides real-time monitoring of all servers and databases. It also allows you to have a large volume of historical data which allows you to analyze trends in the databases.
A de minimis incentive was given to thank the reviewer for their time. The incentive was not used to bias or drive a particular response, nor was the incentive contingent on a positive endorsement. More Info
I also used Monitis as a monitoring service for our server. Rackspace'S monitoring sends immediate notifications while Monitis might take a couple minutes to understand if a service is down. Since Rackspace has their monitoring integrated with their support system, it helps us a lot and we don't need to call support all the time.
A de minimis incentive was given to thank the reviewer for their time. The incentive was not used to bias or drive a particular response, nor was the incentive contingent on a positive endorsement. More Info
A de minimis incentive was given to thank the reviewer for their time. The incentive was not used to bias or drive a particular response, nor was the incentive contingent on a positive endorsement. More Info
A de minimis incentive was given to thank the reviewer for their time. The incentive was not used to bias or drive a particular response, nor was the incentive contingent on a positive endorsement. More Info