KNIME enables users to analyze, upskill, and scale data science without any coding. The platform that lets users blend, transform, model and visualize data, deploy and monitor analytical models, and share insights organization-wide with data apps and services.
$0
per month
Microsoft BI (MSBI)
Score 8.7 out of 10
N/A
Microsoft BI is a business intelligence product used for data analysis and generating reports on server-based data. It features unlimited data analysis capacity with its reporting engine, SQL Server Reporting Services alongside ETL, master data management, and data cleansing.
$14
per month per user
Rational BI
Score 7.7 out of 10
Enterprise companies (1,001+ employees)
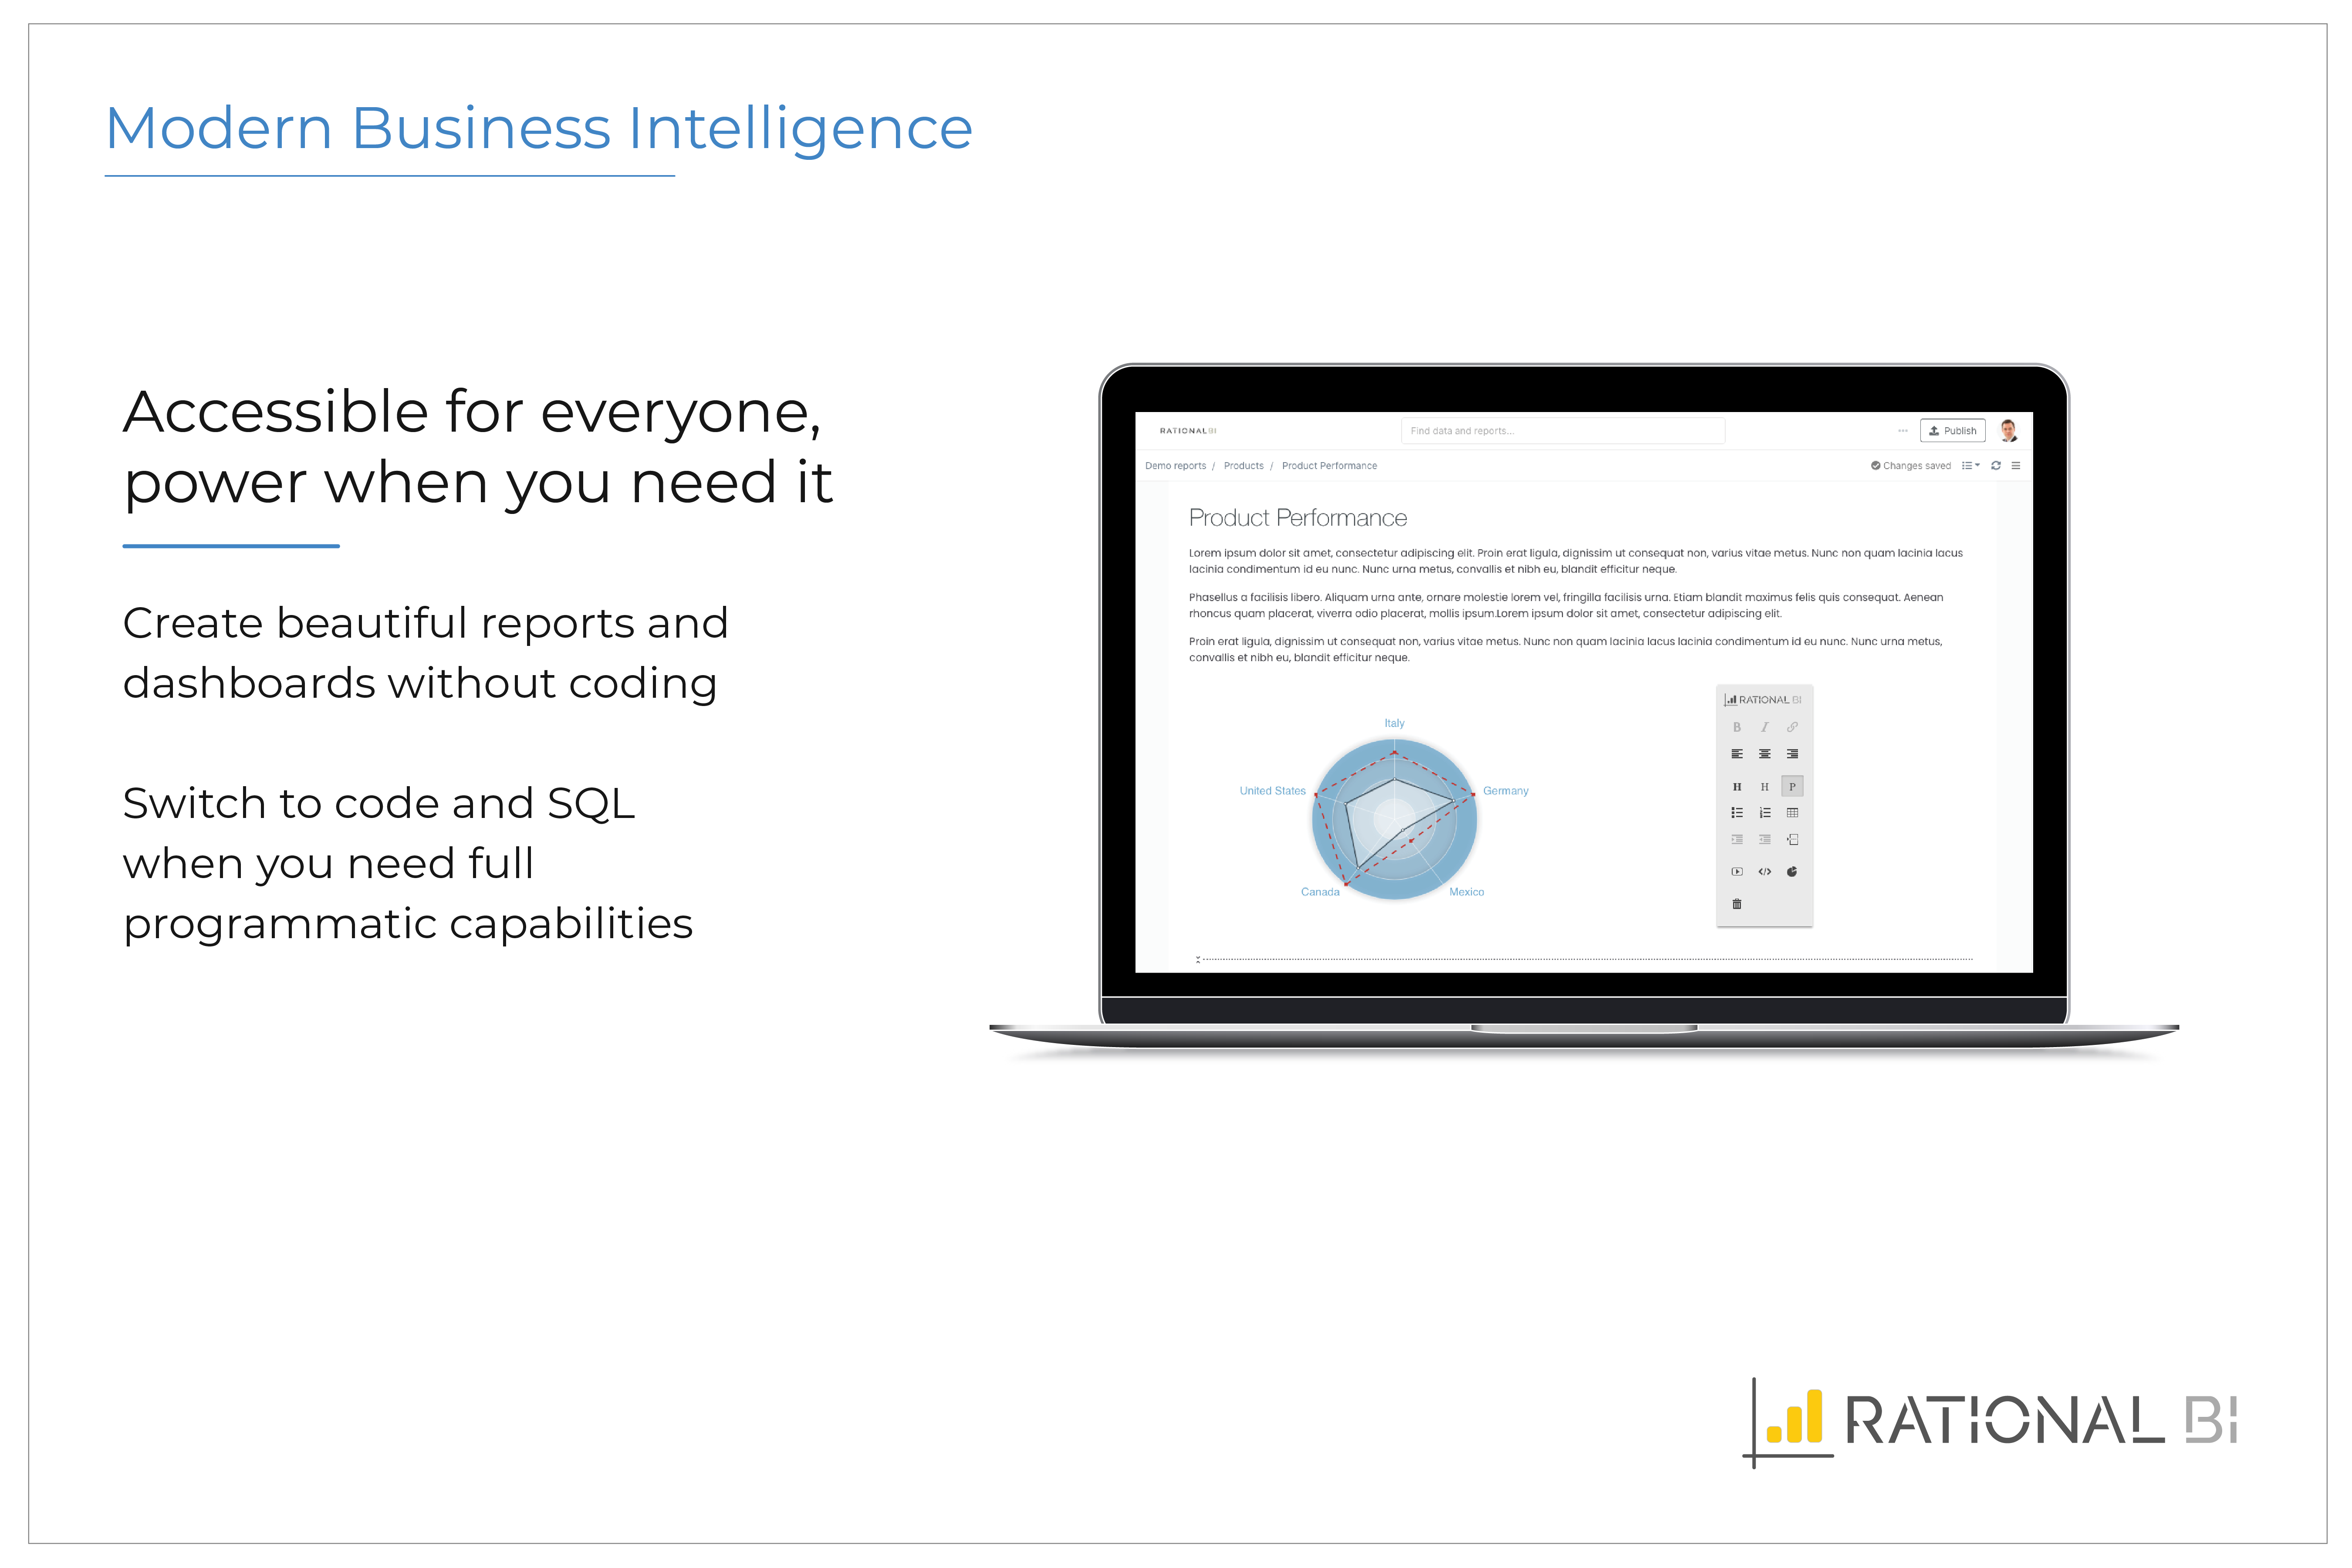
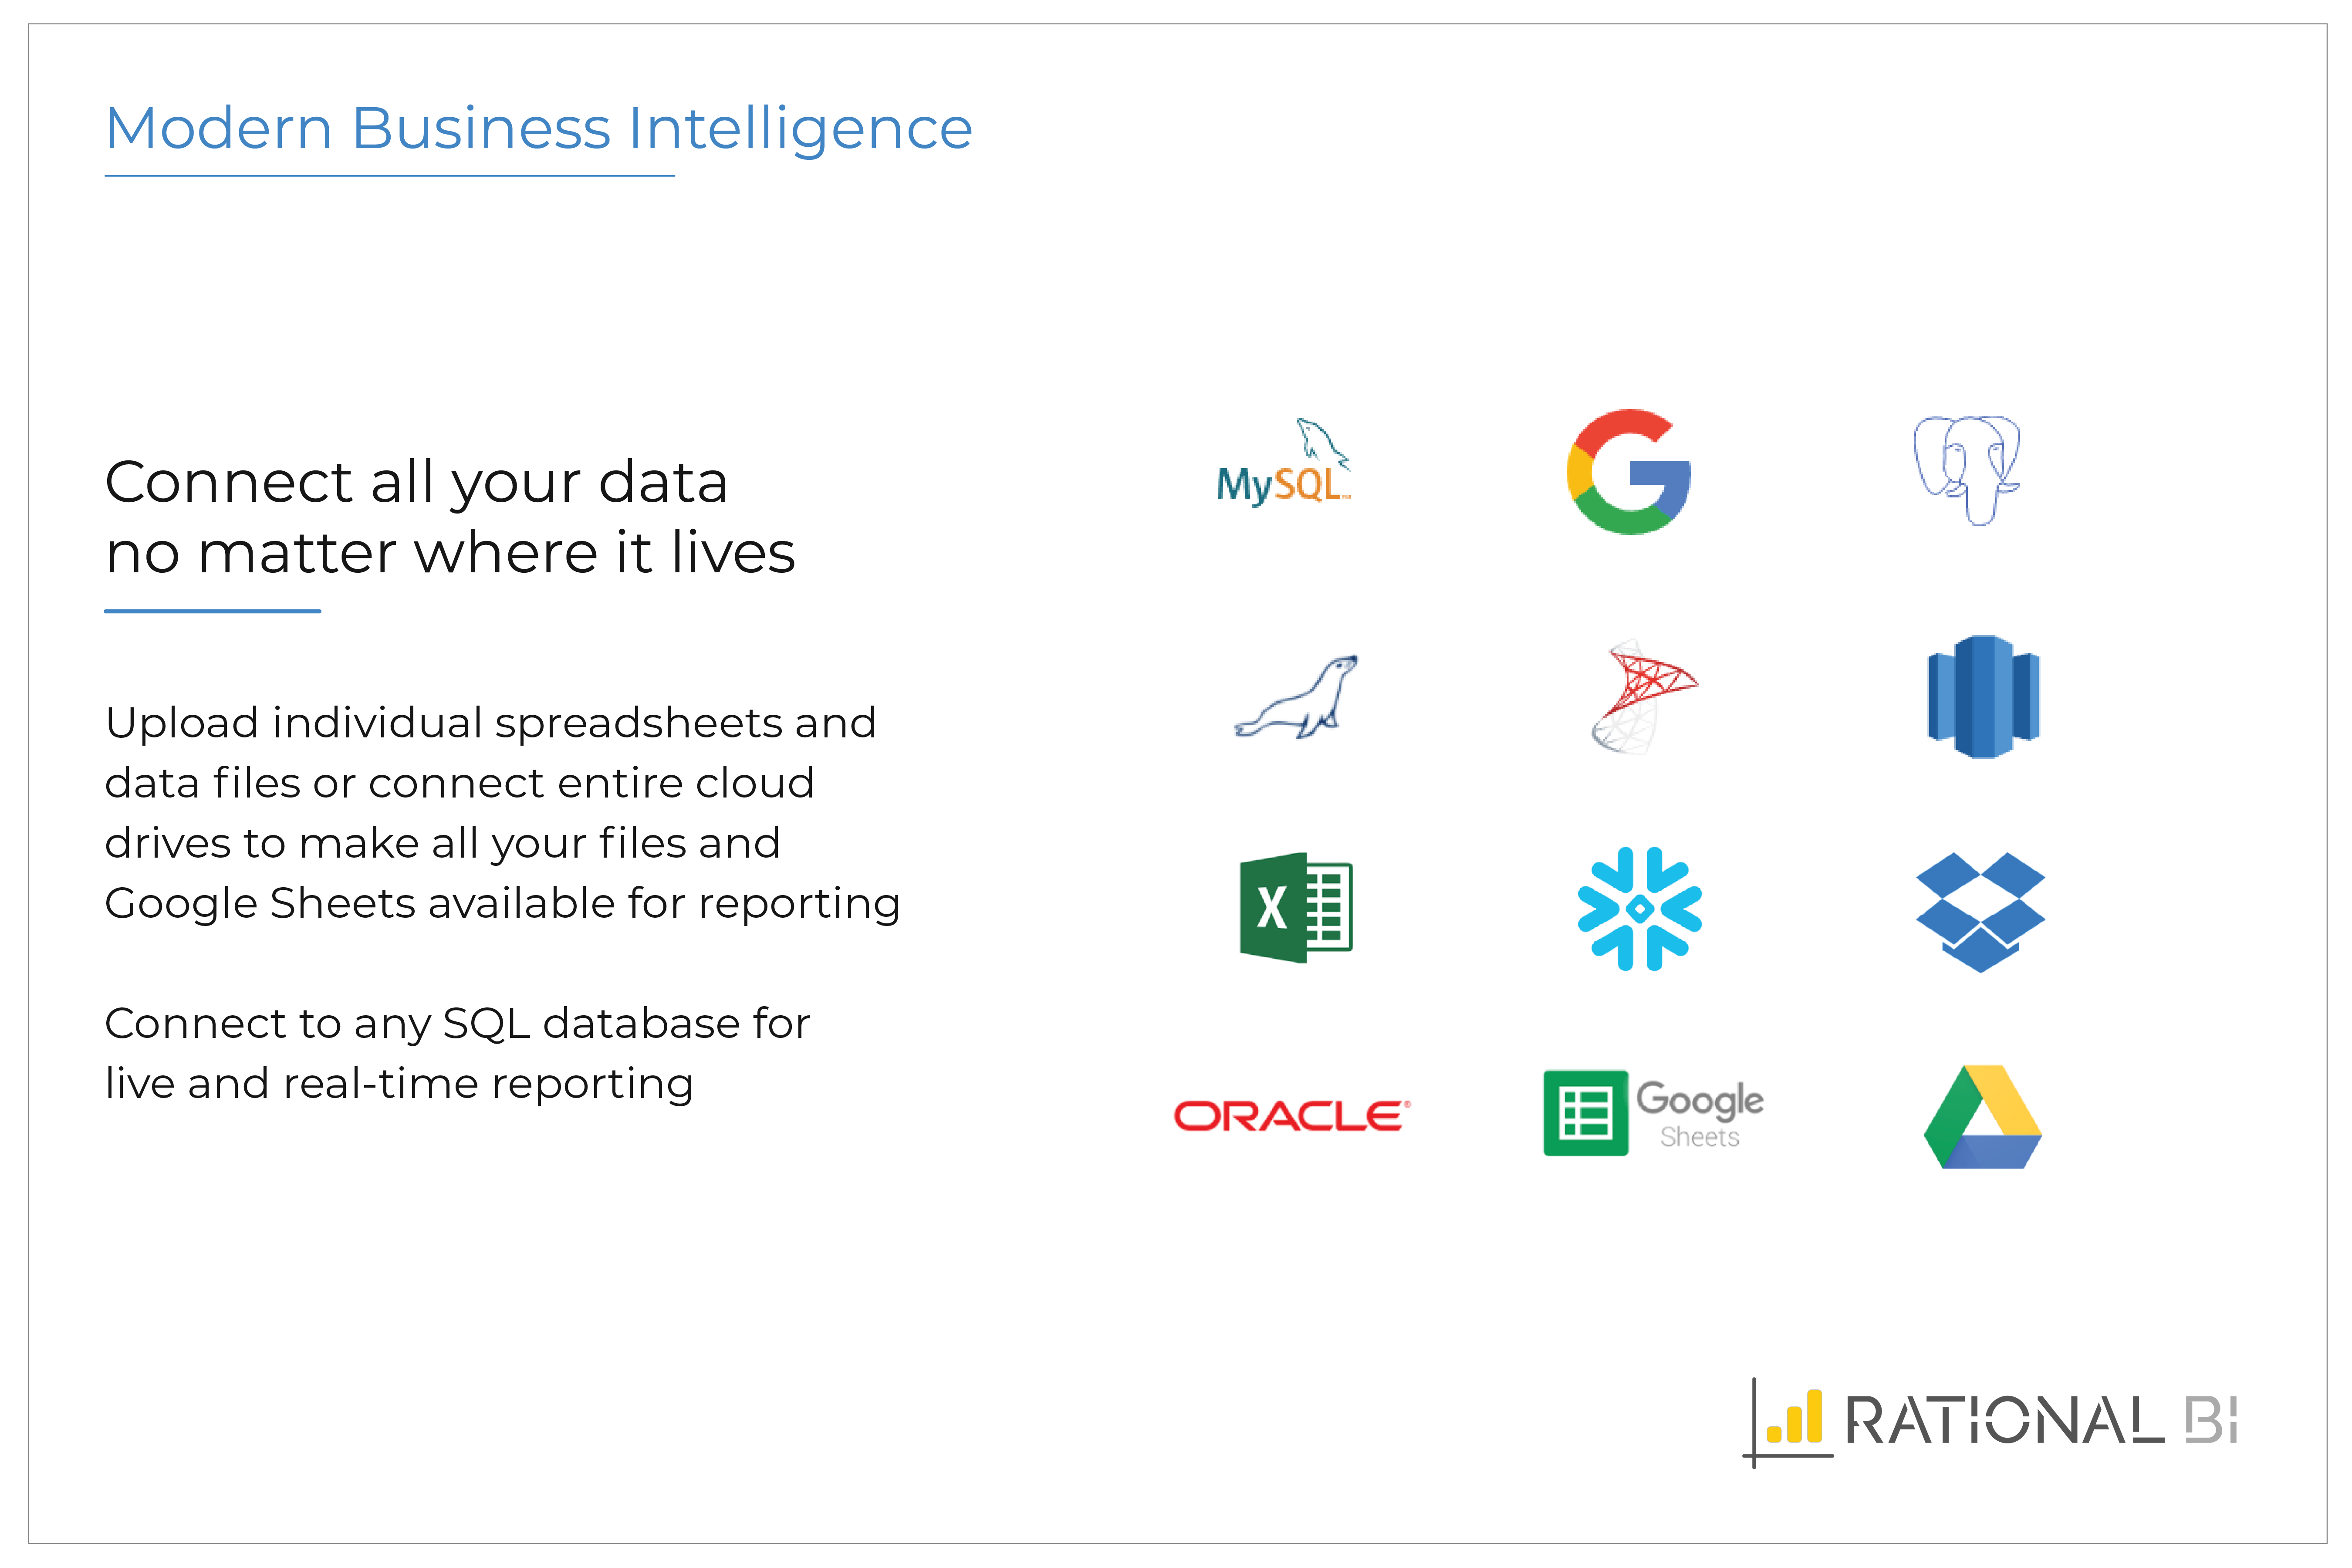
Rational BI provides analytics, data science and business intelligence in an analytical platform that connects to databases, data files and cloud drives including AWS and Azure data sources, enabling users to explore and visualize data. Users can build real-time notebook-style reports directly in a web browser with JavaScript and SQL with direct and live connections to data. Filter and query data with an SQL database embedded in the client, without network…
$0
single user
Pricing
KNIME Analytics Platform
Microsoft BI (MSBI)
Rational BI
Editions & Modules
KNIME Community Hub Personal Plan
$0
KNIME Analytics Platform
$0
KNIME Community Hub Team Plan
€99
per month 3 users
KNIME Business Hub
From €35,000
per year
Power BI Pro
$14
per month per user
Power BI Premium
$24
per month per user
Free
$0
single user
Professional
$129
single user
Enterprise
Varies
single user
Offerings
Pricing Offerings
KNIME Analytics Platform
Microsoft BI (MSBI)
Rational BI
Free Trial
No
No
Yes
Free/Freemium Version
Yes
Yes
Yes
Premium Consulting/Integration Services
No
No
Yes
Entry-level Setup Fee
No setup fee
No setup fee
Optional
Additional Details
—
—
Additional cost per extra user (varies by edition)
More Pricing Information
Community Pulse
KNIME Analytics Platform
Microsoft BI (MSBI)
Rational BI
Features
KNIME Analytics Platform
Microsoft BI (MSBI)
Rational BI
Platform Connectivity
Comparison of Platform Connectivity features of Product A and Product B
KNIME Analytics Platform
9.2
19 Ratings
10% above category average
Microsoft BI (MSBI)
-
Ratings
Rational BI
-
Ratings
Connect to Multiple Data Sources
9.619 Ratings
00 Ratings
00 Ratings
Extend Existing Data Sources
10.010 Ratings
00 Ratings
00 Ratings
Automatic Data Format Detection
9.119 Ratings
00 Ratings
00 Ratings
MDM Integration
7.98 Ratings
00 Ratings
00 Ratings
Data Exploration
Comparison of Data Exploration features of Product A and Product B
KNIME Analytics Platform
8.1
18 Ratings
4% below category average
Microsoft BI (MSBI)
-
Ratings
Rational BI
-
Ratings
Visualization
8.018 Ratings
00 Ratings
00 Ratings
Interactive Data Analysis
8.118 Ratings
00 Ratings
00 Ratings
Data Preparation
Comparison of Data Preparation features of Product A and Product B
KNIME Analytics Platform
8.3
19 Ratings
2% above category average
Microsoft BI (MSBI)
-
Ratings
Rational BI
-
Ratings
Interactive Data Cleaning and Enrichment
9.019 Ratings
00 Ratings
00 Ratings
Data Transformations
9.519 Ratings
00 Ratings
00 Ratings
Data Encryption
7.47 Ratings
00 Ratings
00 Ratings
Built-in Processors
7.48 Ratings
00 Ratings
00 Ratings
Platform Data Modeling
Comparison of Platform Data Modeling features of Product A and Product B
KNIME Analytics Platform
8.0
18 Ratings
5% below category average
Microsoft BI (MSBI)
-
Ratings
Rational BI
-
Ratings
Multiple Model Development Languages and Tools
9.517 Ratings
00 Ratings
00 Ratings
Automated Machine Learning
8.217 Ratings
00 Ratings
00 Ratings
Single platform for multiple model development
9.318 Ratings
00 Ratings
00 Ratings
Self-Service Model Delivery
5.08 Ratings
00 Ratings
00 Ratings
Model Deployment
Comparison of Model Deployment features of Product A and Product B
KNIME Analytics Platform
7.3
11 Ratings
15% below category average
Microsoft BI (MSBI)
-
Ratings
Rational BI
-
Ratings
Flexible Model Publishing Options
8.611 Ratings
00 Ratings
00 Ratings
Security, Governance, and Cost Controls
5.94 Ratings
00 Ratings
00 Ratings
BI Standard Reporting
Comparison of BI Standard Reporting features of Product A and Product B
KNIME Analytics Platform
-
Ratings
Microsoft BI (MSBI)
9.0
53 Ratings
9% above category average
Rational BI
8.3
4 Ratings
3% above category average
Pixel Perfect reports
00 Ratings
8.646 Ratings
7.63 Ratings
Customizable dashboards
00 Ratings
9.653 Ratings
8.74 Ratings
Report Formatting Templates
00 Ratings
9.051 Ratings
8.54 Ratings
Ad-hoc Reporting
Comparison of Ad-hoc Reporting features of Product A and Product B
KNIME Analytics Platform
-
Ratings
Microsoft BI (MSBI)
8.6
53 Ratings
7% above category average
Rational BI
8.3
4 Ratings
6% above category average
Drill-down analysis
00 Ratings
8.648 Ratings
7.73 Ratings
Formatting capabilities
00 Ratings
8.353 Ratings
8.24 Ratings
Integration with R or other statistical packages
00 Ratings
8.442 Ratings
8.03 Ratings
Report sharing and collaboration
00 Ratings
9.053 Ratings
9.24 Ratings
Report Output and Scheduling
Comparison of Report Output and Scheduling features of Product A and Product B
KNIME Analytics Platform
-
Ratings
Microsoft BI (MSBI)
8.6
52 Ratings
5% above category average
Rational BI
9.0
4 Ratings
10% above category average
Publish to Web
00 Ratings
9.448 Ratings
9.03 Ratings
Publish to PDF
00 Ratings
9.248 Ratings
9.04 Ratings
Report Versioning
00 Ratings
7.544 Ratings
8.63 Ratings
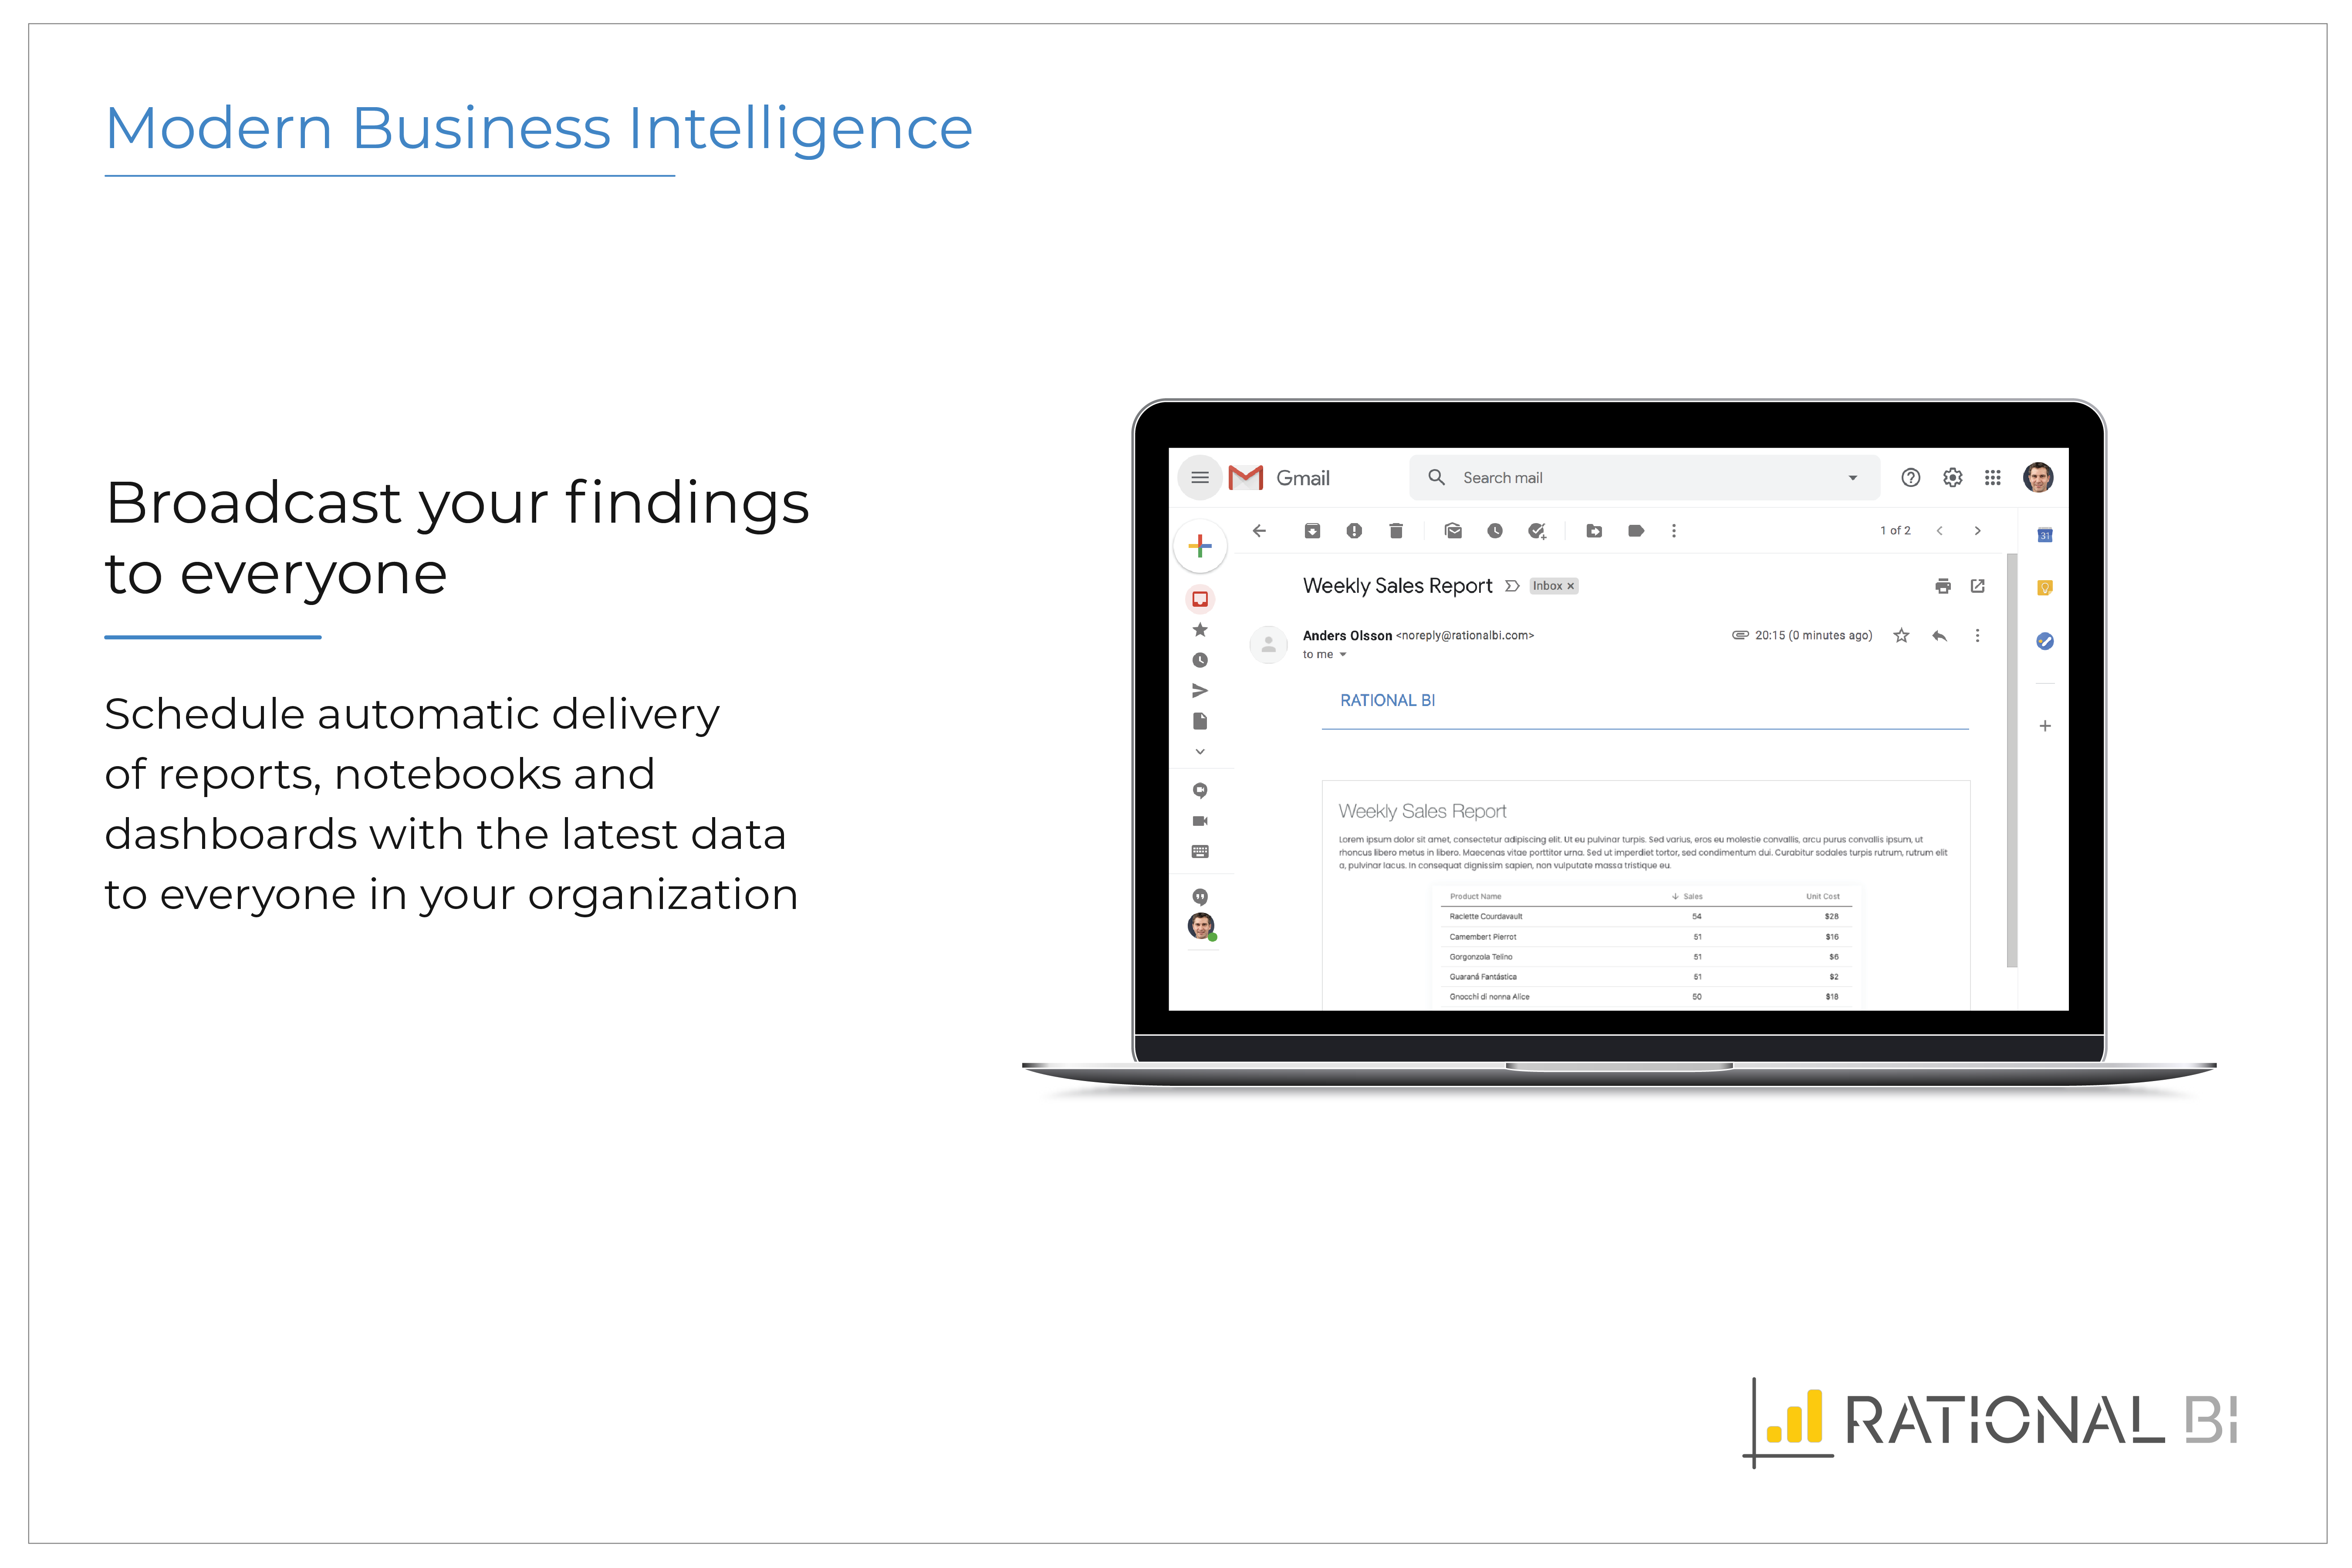
Report Delivery Scheduling
00 Ratings
8.647 Ratings
9.24 Ratings
Delivery to Remote Servers
00 Ratings
8.626 Ratings
9.33 Ratings
Data Discovery and Visualization
Comparison of Data Discovery and Visualization features of Product A and Product B
KNIME Analytics Platform is excellent for people who are finding Excel frustrating, this can be due to errors creeping in due to manual changes or simply that there are too many calculations which causes the system to slow down and crash. This is especially true for regular reporting where a KNIME Analytics Platform workflow can pull in the most recent data, process it and provide the necessary output in one click. I find KNIME Analytics Platform especially useful when talking with audiences who are intimidated by code. KNIME Analytics Platform allows us to discuss exactly how data is processed and an analysis takes place at an abstracted level where non-technical users are happy to think and communicate which is often essential when they are subject matter experts whom you need for guidance. For experienced programmers KNIME Analytics Platform is a double-edged sword. Often programmers wish to write their own code because they are more efficient working that way and are constrained by having to think and implement work in nodes. However, those constraints forcing development in a "KNIME way" are useful when working in teams and for maintenance compared to some programmers' idiosyncratic styles.
Microsoft BI has a lot of features and is a very powerful tool, especially if you have folks on your team that know how to utilize all of its capabilities. To truly unlock all that it can do, it does require people to have a deep understanding of its capabilities. That's where the software really shines. If you are looking for a simpler, more basic reporting tool, there are other programs available that do not require such a steep learning curve.
Definitely well suited for small companies, but again many of their competitors are also well suited in this segment. We were in general happy with the solution provided, but I'm not blown away by their solution or support. If you want to get more data-driven visual boards with data displayed in nice graphics is in my opinion a good start, and here Rational BI delivers what it should.
We are happy with Knime product and their support. Knime AP is versatile product and even can execute Python scripts if needed. It also supports R execution as well; however, it is not being used at our end
Microsoft BI is fundamental to our suite of BI applications. That being said, Northcraft Analytics is focused on delighting our customers, so if the underlying factors of our decision change, we would choose to re-write our BI applications on a different stack. Luckily, mathematics are the fundamental IP of our technology... and is portable across all BI platforms for the foreseeable future.
KNIME Analytics Platform offers a great tradeoff between intuitiveness and simplicity of the user interface and almost limitless flexibility. There are tools that are even easier to adopt by someone new to analytics, but none that would provide the scalability of KNIME when the user skills and application complexity grows
The Microsoft BI tools have great usability for both developers and end users alike. For developers familiar with Visual Studio, there is little learning curve. For those not, the single Visual Studio IDE means not having to learn separate tools for each component. For end-users, the web interface for SSRS is simple to navigate with intuitive controls. For ad-hoc analysis, Excel can connect directly to SSAS and provide a pivot table like experience which is familiar to many users. For database development, there is beginning to be some confusion, as there are now three tool choices (VS, SSMS, Azure Data Studio) for developers. I would like to see Azure Data Studio become the superset of SSMS and eventually supplant it.
Overall Rational BI is a valuable enterprise reporting tool for any data driven organization. It offers great depth and breadth of features for reporting and analytics that can lead to better business outcomes. Its easy to use and highly configurable to evolve to changing reporting needs of organizations of any scale.
SQL Server Reporting Services (SSRS) can drag at times. We created two report servers and placed them under an F5 load balancer. This configuration has worked well. We have seen sluggish performance at times due to the Windows Firewall.
KNIME's HQ is in Europe, which makes it hard for US companies to get customer service in time and on time. Their customer service also takes on average 1 to 2 weeks to follow up with your request. KNIME's documentation is also helpful but it does not provide you all the answers you need some of the time.
MSBI natively has a site that allows you to vote on user enhancements and bug fixes. This allows the largest nagging issues to float to the top and the development team can prioritize accordingly. As mentioned earlier, the large community base of MSBI developers assist technical resources in handling technical questions.
I haven't used the support myself, but my colleagues have been satisfied with the support. As I have understood from my colleagues the support is as you could expect. Still, the documentation could be better and that could avoid the need to contact their support, but overall we're still happy with the support as well.
I have used on-line training from Microsoft and from Pragmatic Works. I would recommend Pragmatic Works as the best way to get up to speed quickly, and then use the Microsoft on-line training to deep dive into specific features that you need to get depth with.
KNIME Analytics Platform is easy to install on any Windows, Mac or Linux machine. The KNIME Server product that is currently being replaced by the KNIME Business Hub comes as multiple layers of software and it took us some time to set up the system right for stability. This was made harder by KNIME staff's deeper expertise in setting up the Server in Linux rather than Windows environment. The KNIME Business Hub promises to have a simpler architecture, although currently there is no visibility of a Windows version of the product.
We are a consulting firm and as such our best resources are always billing on client projects. Our internal implementation has weaknesses, but that's true for any company like ours. My rating is based on the product's ease of implementation.
Having used both the Alteryx and [KNIME Analytics] I can definitely feel the ease of using the software of Alteryx. The [KNIME Analytics] on the other hand isn't that great but is 90% of what Alteryx can do along with how much ease it can do. Having said that, the 90% functionality and UI at no cost would be enough for me to quit using Alteryx and move towards [KNIME Analytics].
We have used the built in ConnectWise Manager reports and custom reports. The reports provide static data. PowerBI shows us live data we can drill down into and easily adjust parameters. It's much more useful than a static PDF report.
Rational BI allows a deeper data analysis with respect to the other software I experimented with. The velocity to perform the analysis is similar to the other one. The predictive analysis could be very useful, but at the moment I do not use it in my activities. Dashboards are nice and easy to understand.
It is suited for data mining or machine learning work but If we're looking for advanced stat methods such as mixed effects linear/logistics models, that needs to be run through an R node.
Thinking of our peers with an advanced visualization techniques requirement, it is a lagging product.
As a SaaS provider we see being able to provide self-service BI to our client users as a competitive advantage. In fact the MSSQL enabled BI is a contributing factor to many winning RFPs we have done for prospective client organisations.
However MSSQL BI requires extensive knowledge and skills to design and develop data warehouses & data models as a foundation to support business analysts and users to interrogate data effectively and efficiently. Often times we find having strong in-house MSSQL expertise is a bless.