Carto (formerly CartoDB) in Brooklyn, New York offers their location intelligence solution.
N/A
MAPOG
Score 0.0 out of 10
N/A
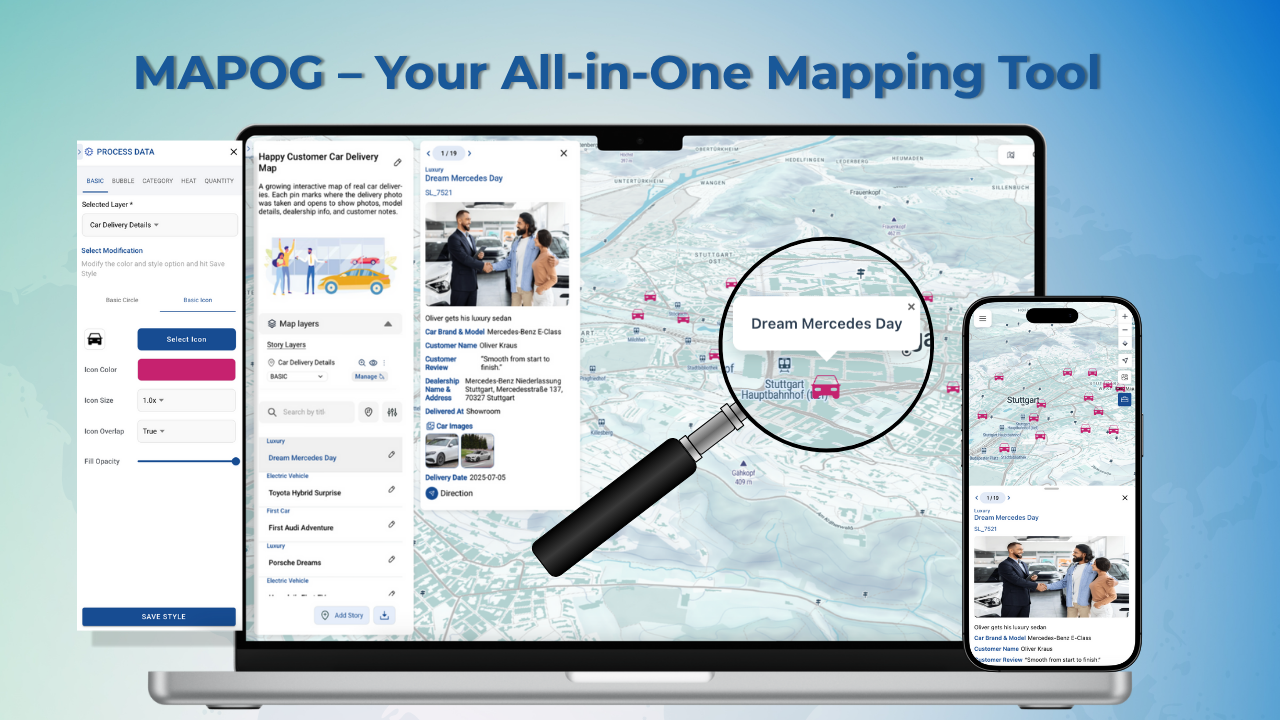
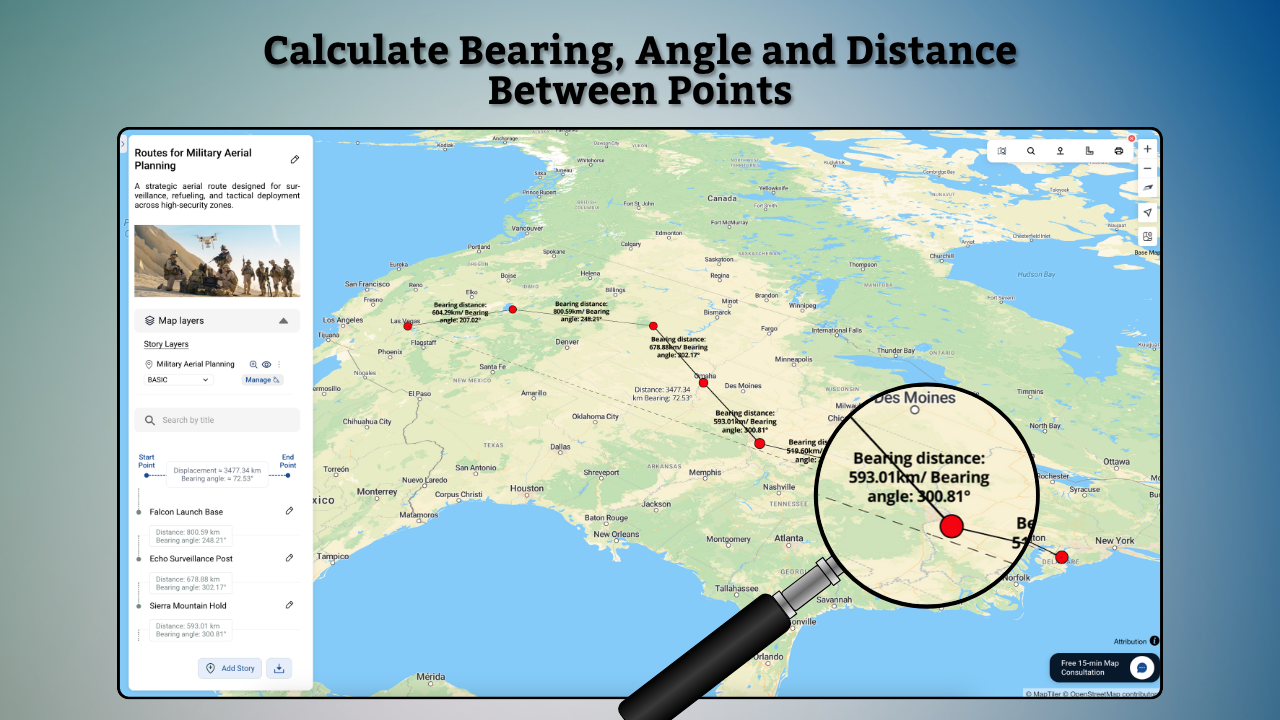
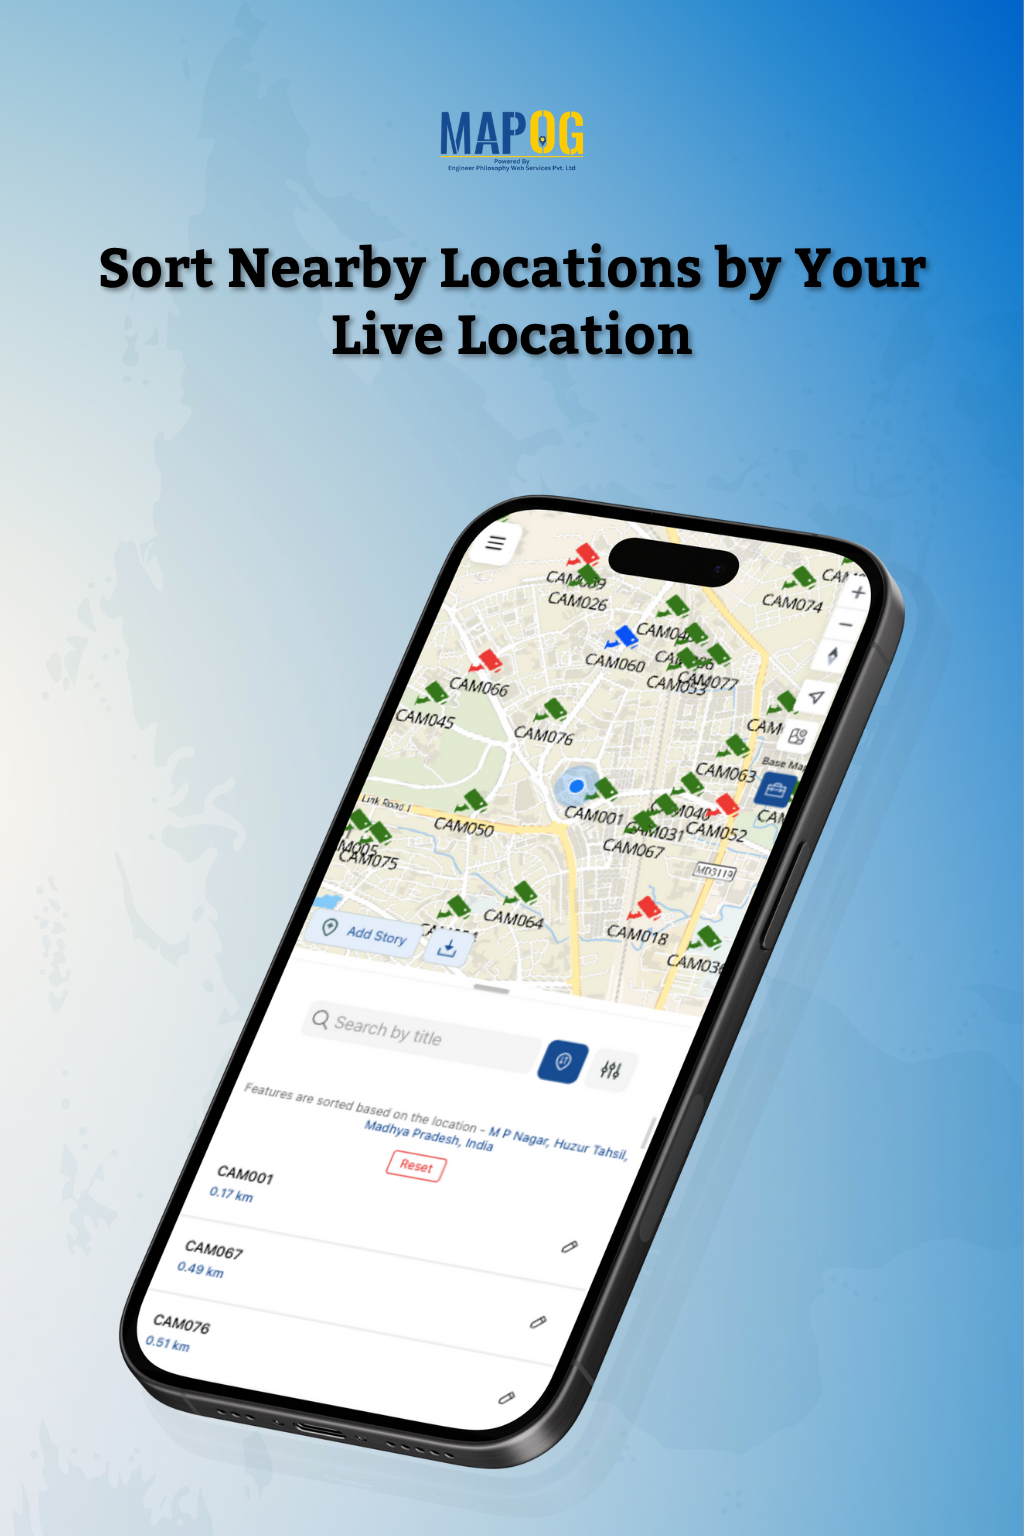
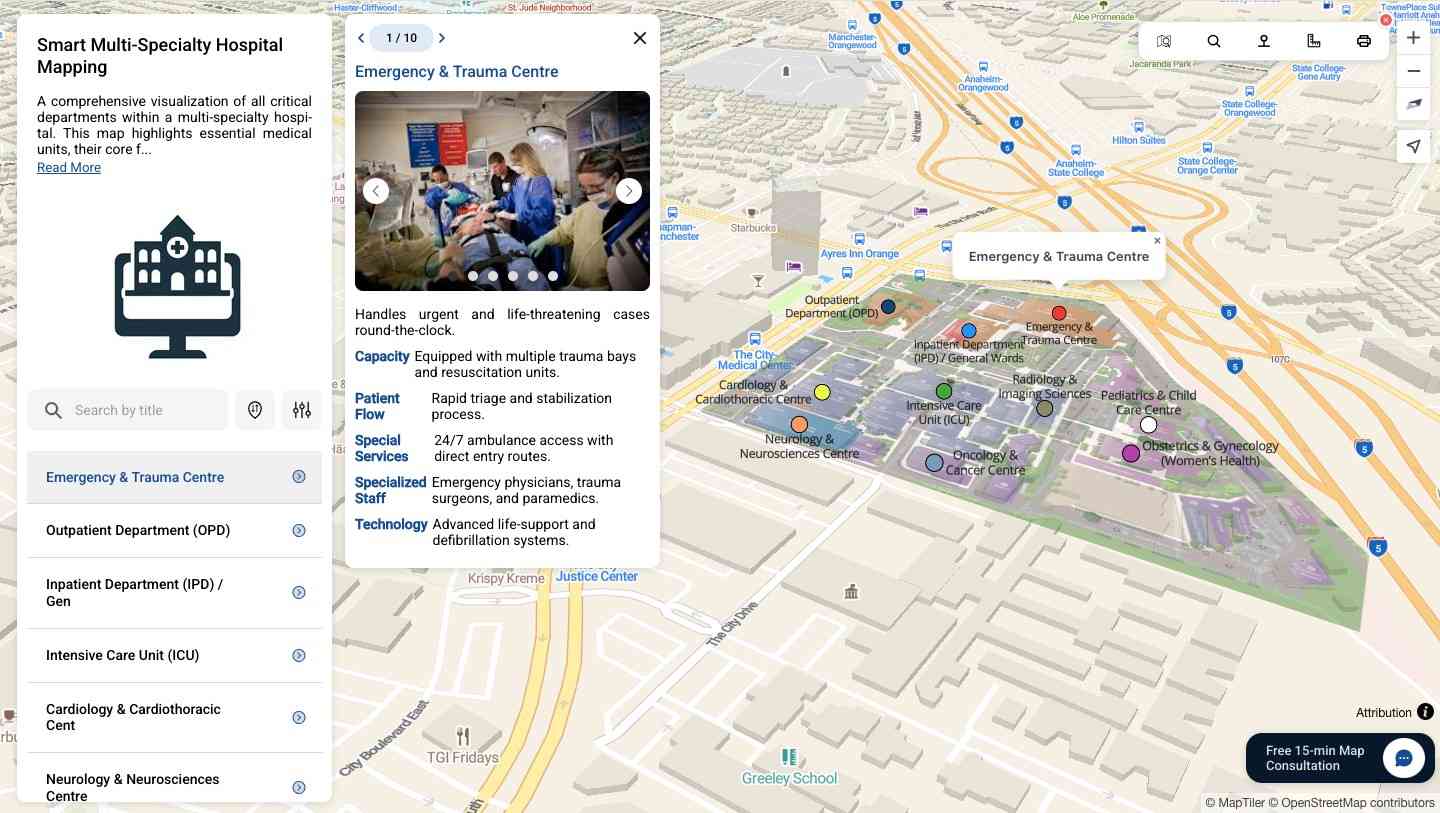
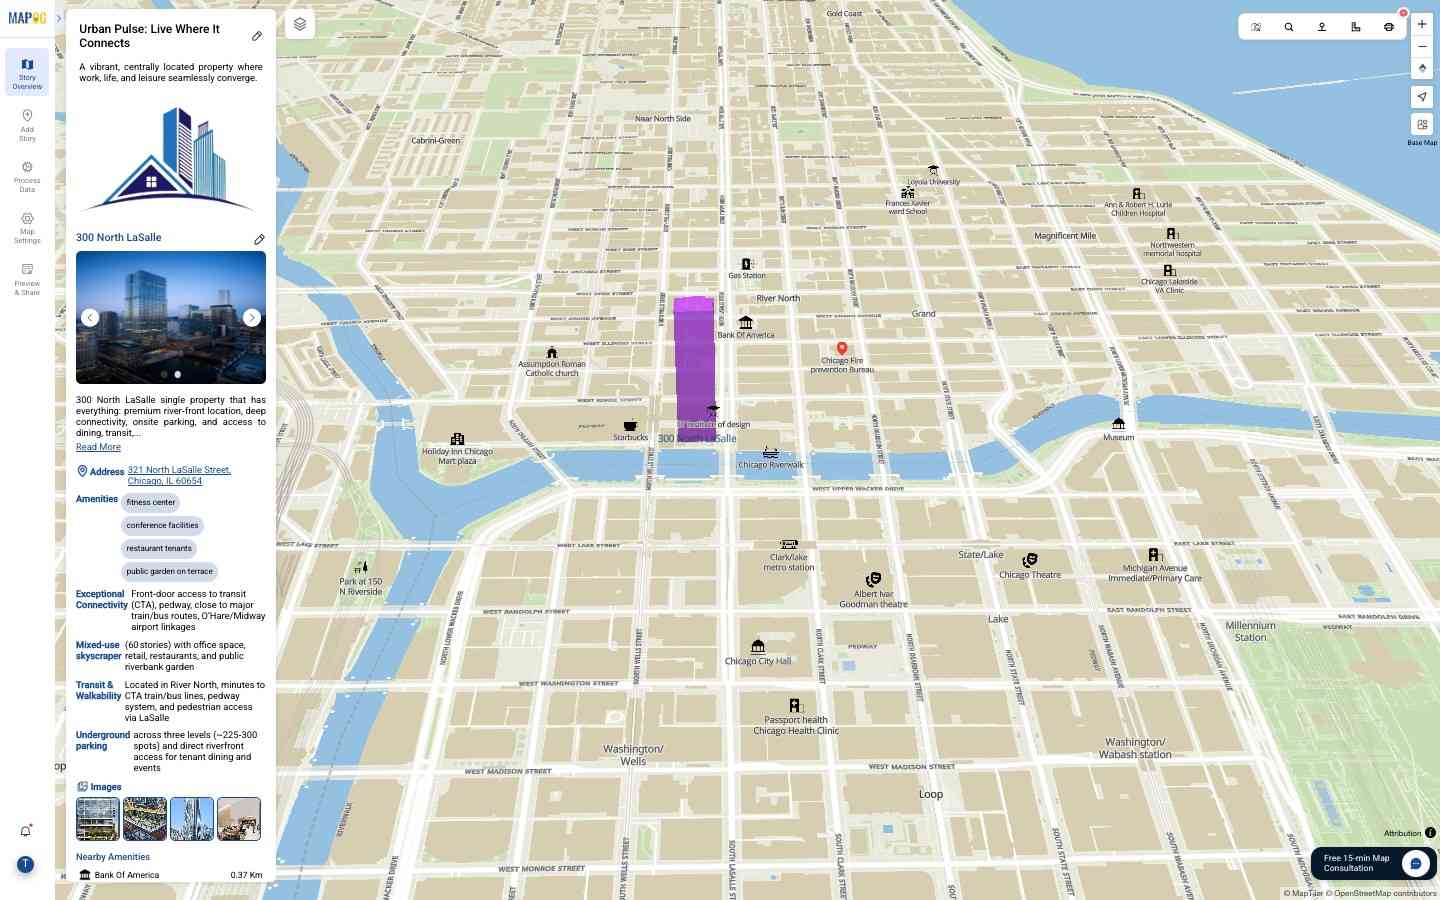
MAPOG is a mapping platform that transforms locations, projects, portfolios, and data into interactive visual maps. Instead of scattered files or reports, users can import data from CSV or Excel and display every site on a single map with photos, videos, links, and key details for each point. Users can add custom base maps using geo-referencing to showcase campuses, layouts, or property overviews, and use bearing angle measurement for navigation, planning, or…
$9
per month per user
Pricing
CARTO
MAPOG
Editions & Modules
No answers on this topic
MAPOG Pro
$9
per month per user
MAPOG Business Plan
$29
per month per user
MAPOG Business+ Plan
$99
per month per user
Offerings
Pricing Offerings
CARTO
MAPOG
Free Trial
No
Yes
Free/Freemium Version
No
No
Premium Consulting/Integration Services
No
No
Entry-level Setup Fee
No setup fee
No setup fee
Additional Details
—
Pro Plan: Best for individuals, startups, or small teams. Includes up to 10 maps, 1,000 story points, basic geocoding, and AI-powered story creation.
Monthly: $9.0/month
Annual: $7.5/month ($90/year, save up to 40% with annual billing)
Business Plan: Ideal for growing teams needing more maps, data points, advanced geocoding, layer tools, and GIS AI queries.
Monthly: $21.0/month
Annual: $21/month ($252/year, save up to 40% with annual billing)
Business+ Plan: Designed for large enterprises with unlimited maps, up to 1,000,000 story points, 8 GB storage, enterprise-grade collaboration, and premium support.
Monthly: $99.0/month
Annual: $58/month ($696/year, save up to 40% with annual billing)
Additional Users: Add team members for $5.63/month
Python is definitely a more powerful tool for data munging and analysis, but the python packages for geo-related data viz (bokeh, matplotlib, seaborn) are cumbersome to use. I would recommend doing your data analysis in Python and then exporting the final data to CartoDB for …
Google Maps API was what we started with. It provides a lot of nice tools, but they are all browser-side. This means that when you want to display points on a map you send data to the users browser and the software runs on the users's machine to render that data into points. …
I have not seen a better mapping tool than CartoDB. You get the familiarity of Google Maps with arbitrarily complex geographic data visualization on top. CartoDB excels at large data sets where Google Maps API completely chokes when attempting to handle more than ~1000 data points. I was able to plot 500,000 points on a map with reasonable speed and able to perform complex aggregations to display boundaries of areas containing certain types of data, intersections of those sections, and more.
Learning curve - CartoDB might be difficult to use if you don't have a bit of SQL or data structures background. If you're not familiar with floats, strings, etc., you might upload an Excel file and be confused about how to manipulate it to get the software to create the maps that you want.
Performance - When I used it, there were some occasional issues with loading and parsing large data files.
Python is definitely a more powerful tool for data munging and analysis, but the python packages for geo-related data viz (bokeh, matplotlib, seaborn) are cumbersome to use. I would recommend doing your data analysis in Python and then exporting the final data to CartoDB for visualization. One benefit of doing this is that CartoDB can automatically publish your viz to a link or object, so you don't have to export it and host it yourself. Another benefit is that CartoDB automatically updates the viz once you change the data, eliminating the need to continuously regenerate image files. I haven't used Tableau too extensively, but from the experience I've had with it -- Tableau is better suited for traditional analytical visualization (charts, graphs, etc.) than for geospatial mapping and visualization.