Microsoft BI (MSBI) vs. Powerslide vs. Rational BI
Microsoft BI (MSBI) vs. Powerslide vs. Rational BI
| Product | Rating | Most Used By | Product Summary | Starting Price |
|---|---|---|---|---|
 Microsoft BI (MSBI) | N/A | Microsoft BI is a business intelligence product used for data analysis and generating reports on server-based data. It features unlimited data analysis capacity with its reporting engine, SQL Server Reporting Services alongside ETL, master data management, and data cleansing. | $14 per month per user | |
 Powerslide | N/A | Created in 2019, Powerslide is a data storytelling and data visualization solution. This software helps business users to create usages around data. Powerslide is a solution for data analysis, visualization and presentation. Interactive and collaborative, Powerslide aims to answer data issues in a simple, practical and design interface, and help users simplify the analysis and communication of… | N/A | |
 Rational BI | Enterprise companies (1,001+ employees) | Rational BI provides analytics, data science and business intelligence in an analytical platform that connects to databases, data files and cloud drives including AWS and Azure data sources, enabling users to explore and visualize data. Users can build real-time notebook-style reports directly in a web browser with JavaScript and SQL with direct and live connections to data. Filter and query data with an SQL database embedded in the client, without network… | $0 single user |
| Microsoft BI (MSBI) | Powerslide | Rational BI | ||||||||||||||||||||||
|---|---|---|---|---|---|---|---|---|---|---|---|---|---|---|---|---|---|---|---|---|---|---|---|---|
| Editions & Modules |
| No answers on this topic |
| |||||||||||||||||||||
| Offerings |
| |||||||||||||||||||||||
| Entry-level Setup Fee | No setup fee | Optional | Optional | |||||||||||||||||||||
| Additional Details | — | Our rates are flexible and adapt to the size and use of your organization. Contact us and let’s discuss about it. | Additional cost per extra user (varies by edition) | |||||||||||||||||||||
| More Pricing Information | ||||||||||||||||||||||||
| Microsoft BI (MSBI) | Powerslide | Rational BI |
|---|
| Microsoft BI (MSBI) | Powerslide | Rational BI | |||||||||||||||||||||||||||
|---|---|---|---|---|---|---|---|---|---|---|---|---|---|---|---|---|---|---|---|---|---|---|---|---|---|---|---|---|---|
| BI Standard Reporting |
| ||||||||||||||||||||||||||||
| Ad-hoc Reporting |
| ||||||||||||||||||||||||||||
| Report Output and Scheduling |
| ||||||||||||||||||||||||||||
| Data Discovery and Visualization |
| ||||||||||||||||||||||||||||
| Access Control and Security |
| ||||||||||||||||||||||||||||
| Mobile Capabilities |
| ||||||||||||||||||||||||||||
| Application Program Interfaces (APIs) / Embedding |
|
| Microsoft BI (MSBI) | Powerslide | Rational BI | |
|---|---|---|---|
| Small Businesses |  Yellowfin Score 8.6 out of 10 |  Supermetrics Score 9.8 out of 10 | Supermetrics Score 9.8 out of 10 |
| Medium-sized Companies |  Reveal Score 10.0 out of 10 | Supermetrics Score 9.8 out of 10 | Supermetrics Score 9.8 out of 10 |
| Enterprises |  Kyvos Semantic Layer Score 9.5 out of 10 |  IBM Analytics Engine Score 7.1 out of 10 | IBM Analytics Engine Score 7.1 out of 10 |
| All Alternatives | View all alternatives | View all alternatives | View all alternatives |
| Microsoft BI (MSBI) | Powerslide | Rational BI | |
|---|---|---|---|
| Likelihood to Recommend | 8.9 (77 ratings) | 9.5 (2 ratings) | 7.7 (4 ratings) |
| Likelihood to Renew | 8.0 (25 ratings) | - (0 ratings) | - (0 ratings) |
| Usability | 8.9 (19 ratings) | - (0 ratings) | 8.7 (4 ratings) |
| Availability | 9.5 (2 ratings) | - (0 ratings) | - (0 ratings) |
| Performance | 7.0 (2 ratings) | - (0 ratings) | - (0 ratings) |
| Support Rating | 8.9 (15 ratings) | - (0 ratings) | 7.7 (4 ratings) |
| In-Person Training | 6.9 (3 ratings) | - (0 ratings) | - (0 ratings) |
| Online Training | 8.5 (2 ratings) | - (0 ratings) | - (0 ratings) |
| Implementation Rating | 9.6 (7 ratings) | - (0 ratings) | - (0 ratings) |
| Configurability | 10.0 (2 ratings) | - (0 ratings) | - (0 ratings) |
| Microsoft BI (MSBI) | Powerslide | Rational BI | |
|---|---|---|---|
| Likelihood to Recommend | Microsoft
 Adam Montgomery Partnership Manager | Datarocks
| Rational BI
|
| Pros | Microsoft
 Nilufa Hossain IT Specialist | Datarocks
 Nitish kumar System Engineer | Rational BI
|
| Cons | Microsoft
| Datarocks
| Rational BI
 Judy L. Berglund Solutions Architect - Infrastructure Solutions Group |
| Likelihood to Renew | Microsoft
 Lee Cullom President | Datarocks No answers on this topic | Rational BI No answers on this topic |
| Usability | Microsoft
| Datarocks No answers on this topic | Rational BI
|
| Reliability and Availability | Microsoft
 Robert Goodman Director, Business Intelligence & Analytics | Datarocks No answers on this topic | Rational BI No answers on this topic |
| Performance | Microsoft
Robert Goodman Director, Business Intelligence & Analytics | Datarocks No answers on this topic | Rational BI No answers on this topic |
| Support Rating | Microsoft
| Datarocks No answers on this topic | Rational BI
|
| In-Person Training | Microsoft
 Stephanie Grice Business Intelligence Analyst | Datarocks No answers on this topic | Rational BI No answers on this topic |
| Online Training | Microsoft
 Sean Brady Business Intelligence Architect | Datarocks No answers on this topic | Rational BI No answers on this topic |
| Implementation Rating | Microsoft
 Jacob Saunders National Practice Director - Business Intelligence | Datarocks No answers on this topic | Rational BI No answers on this topic |
| Alternatives Considered | Microsoft
| Datarocks
| Rational BI
|
| Return on Investment | Microsoft
 Haibo Yang BI Reporting Specialist | Datarocks
| Rational BI
Judy L. Berglund Solutions Architect - Infrastructure Solutions Group |
| ScreenShots | Powerslide Screenshots    | Rational BI Screenshots  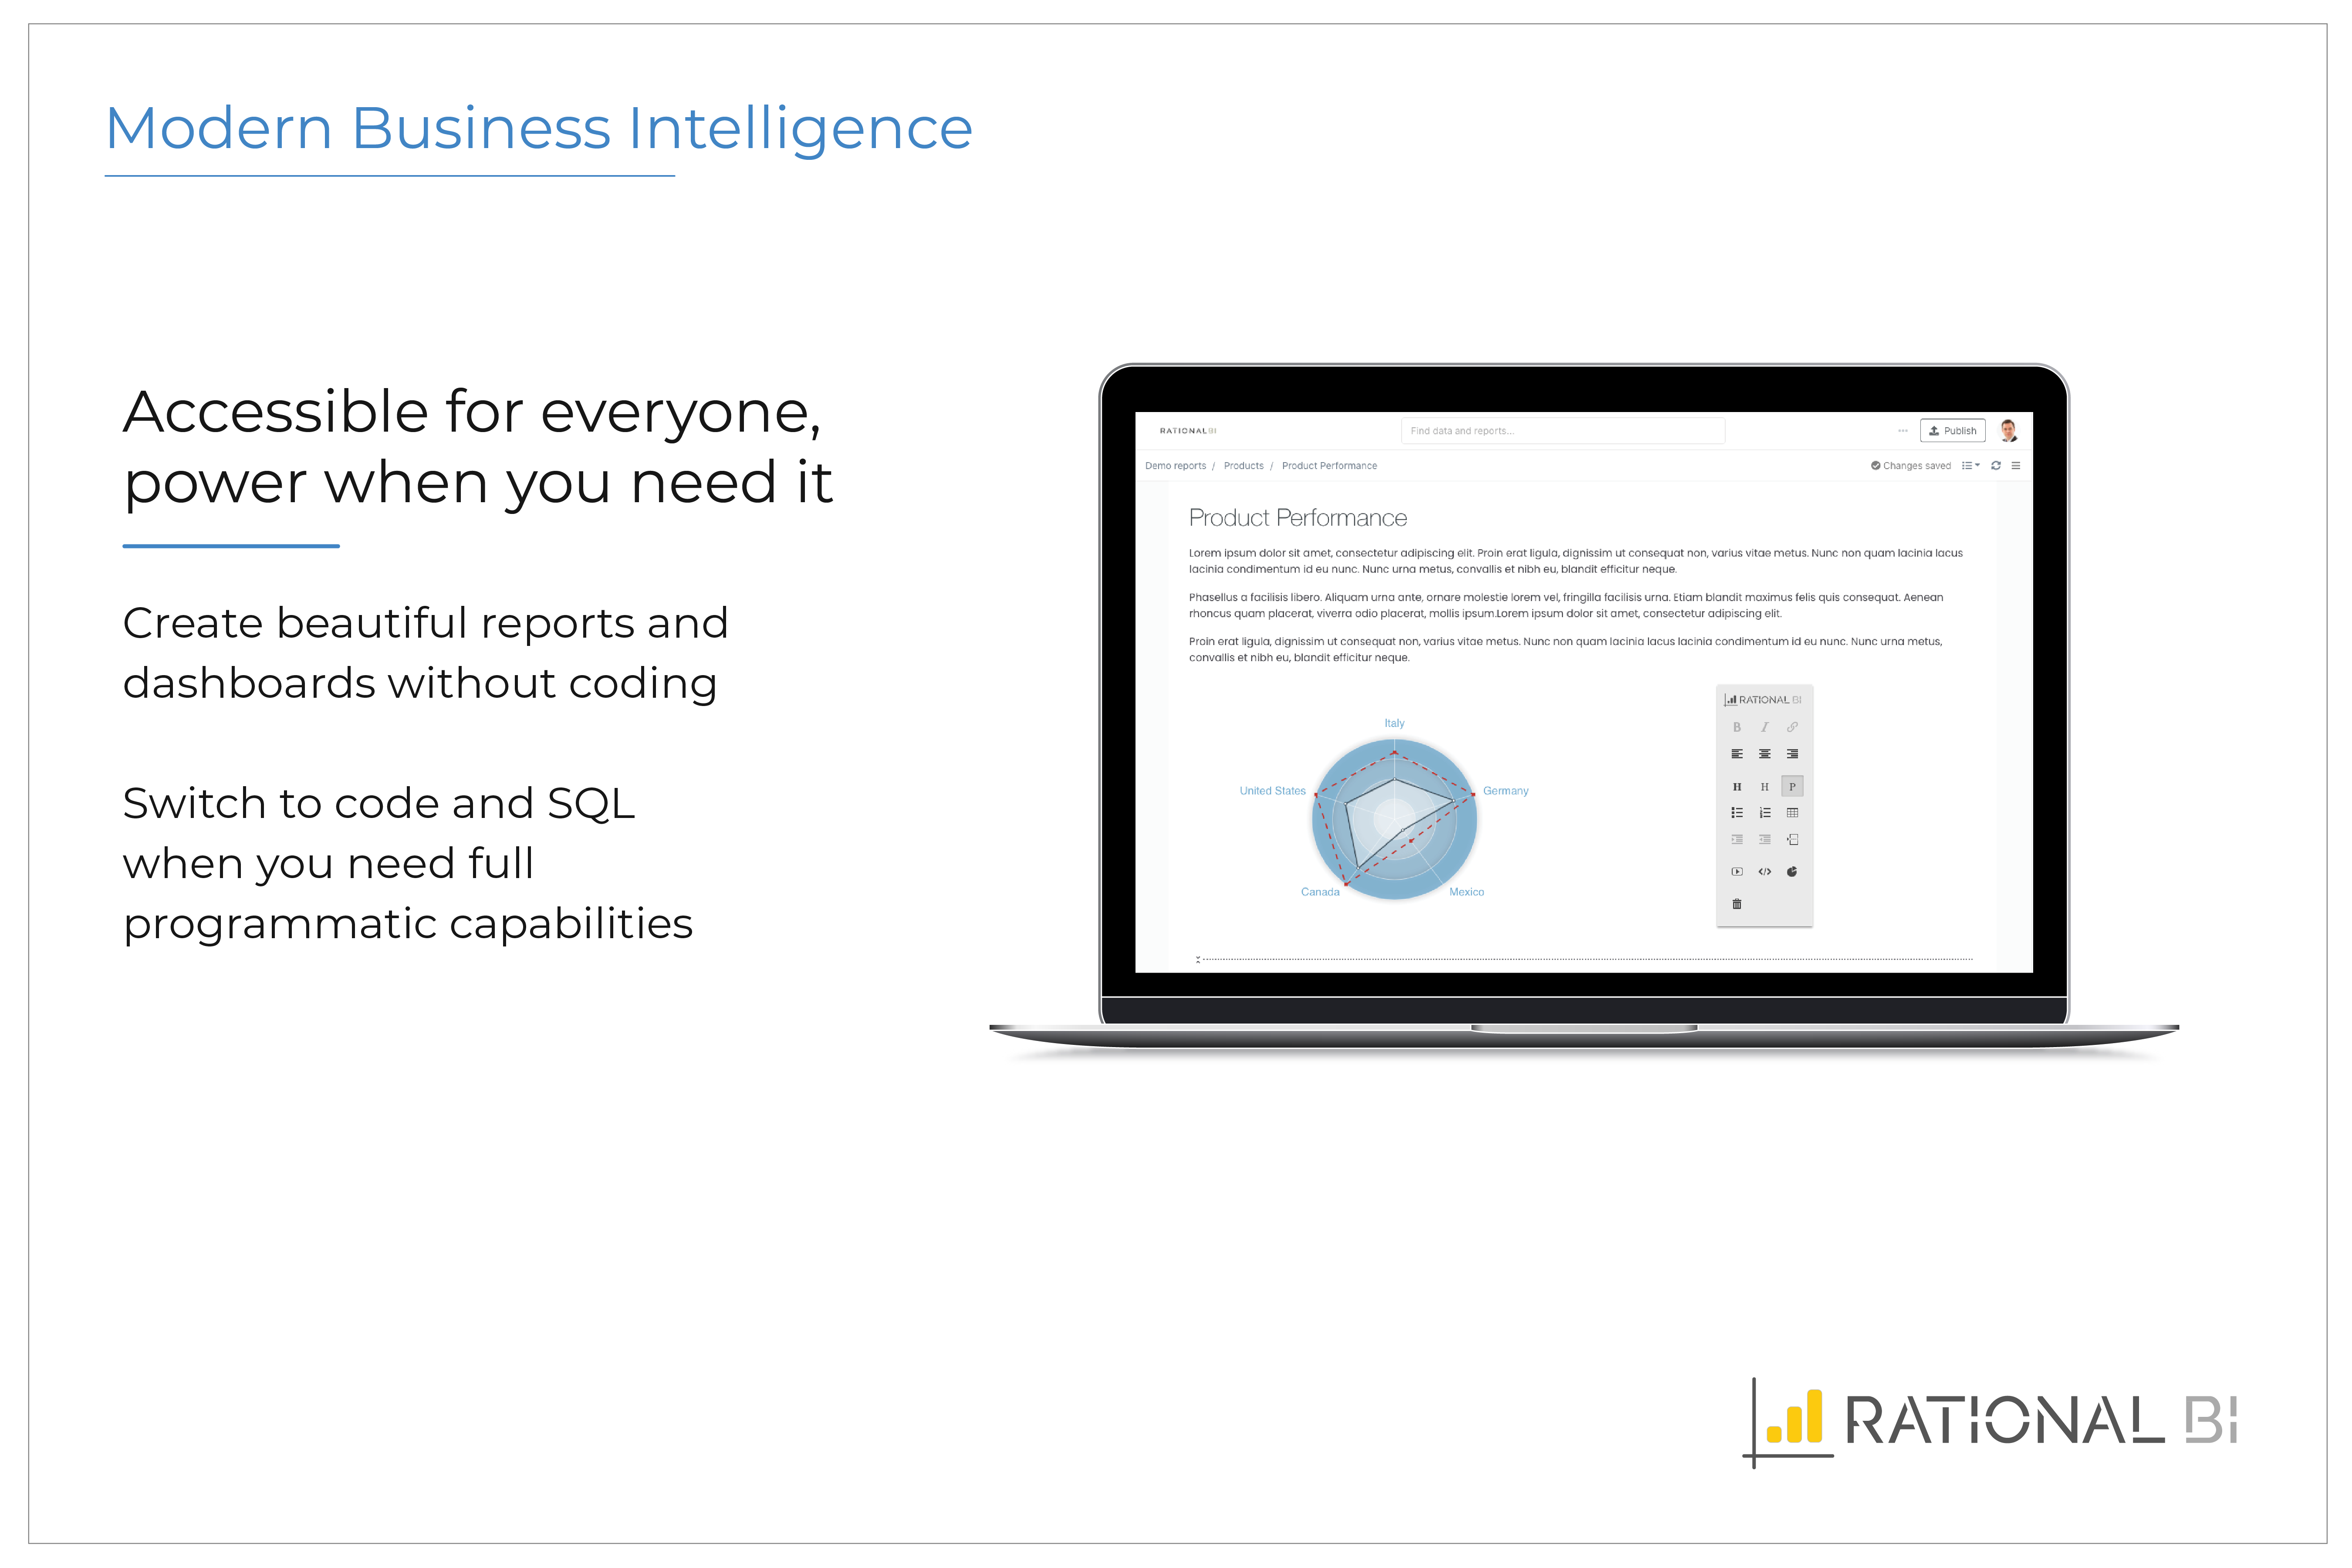  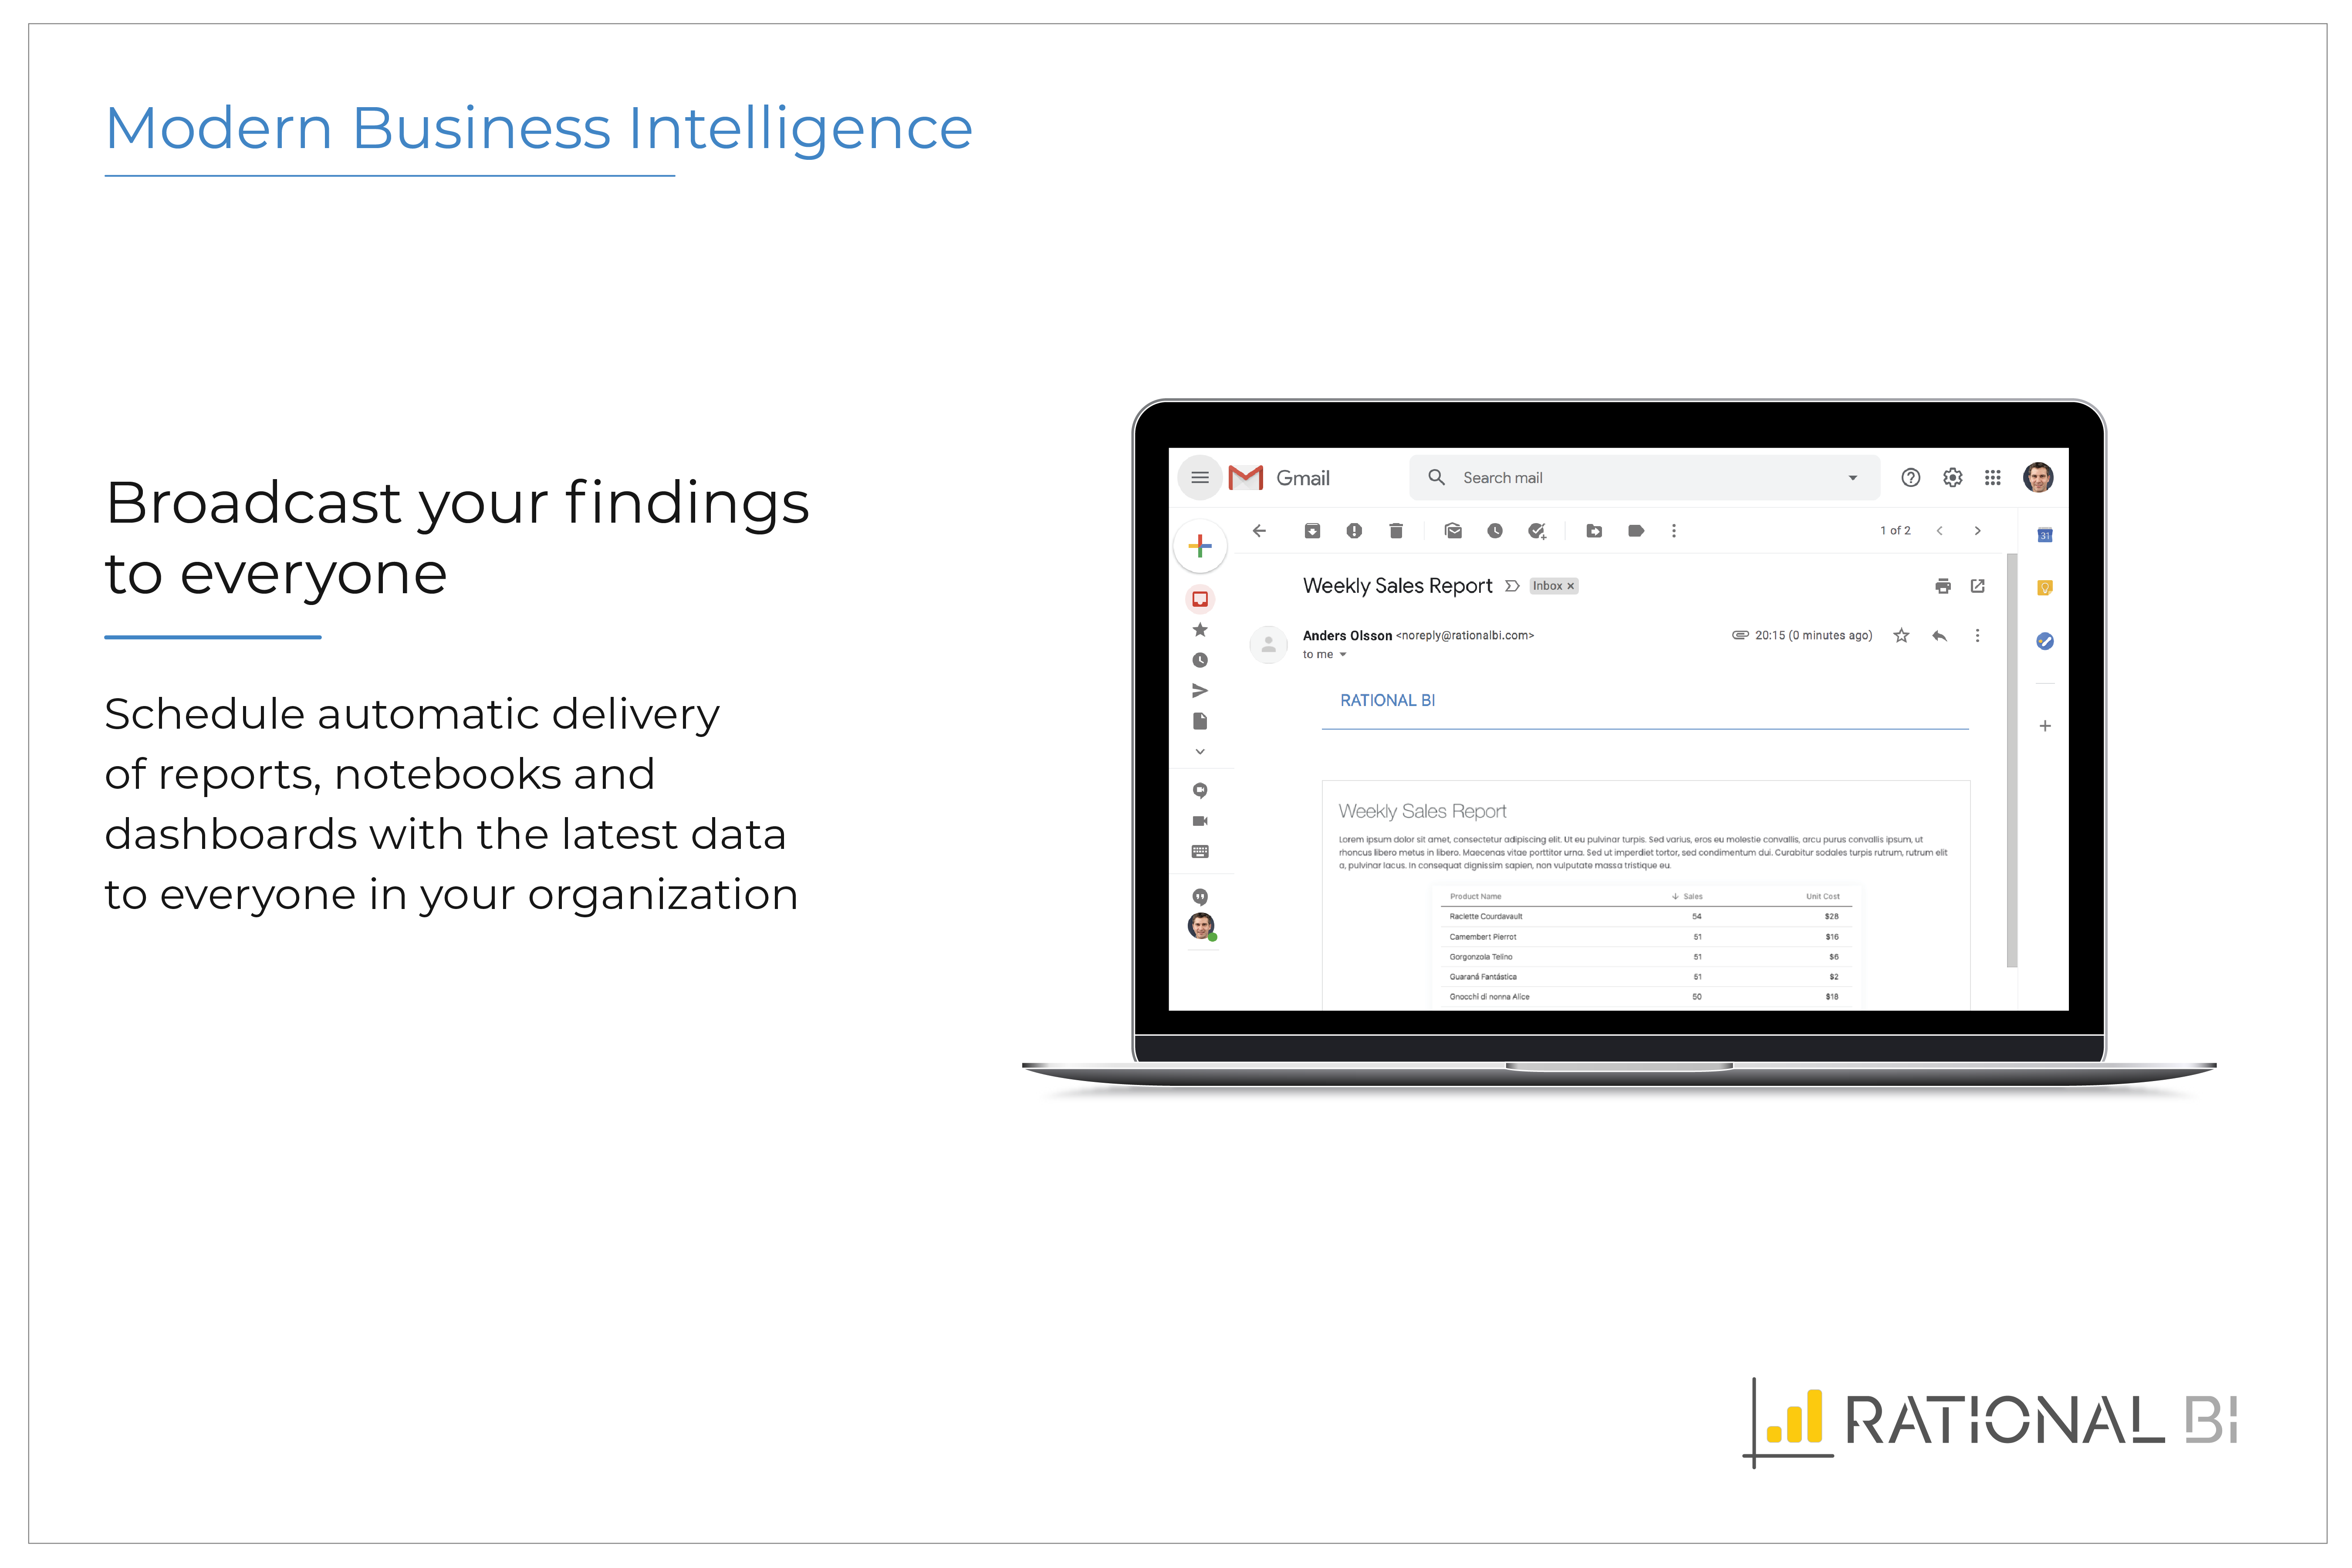 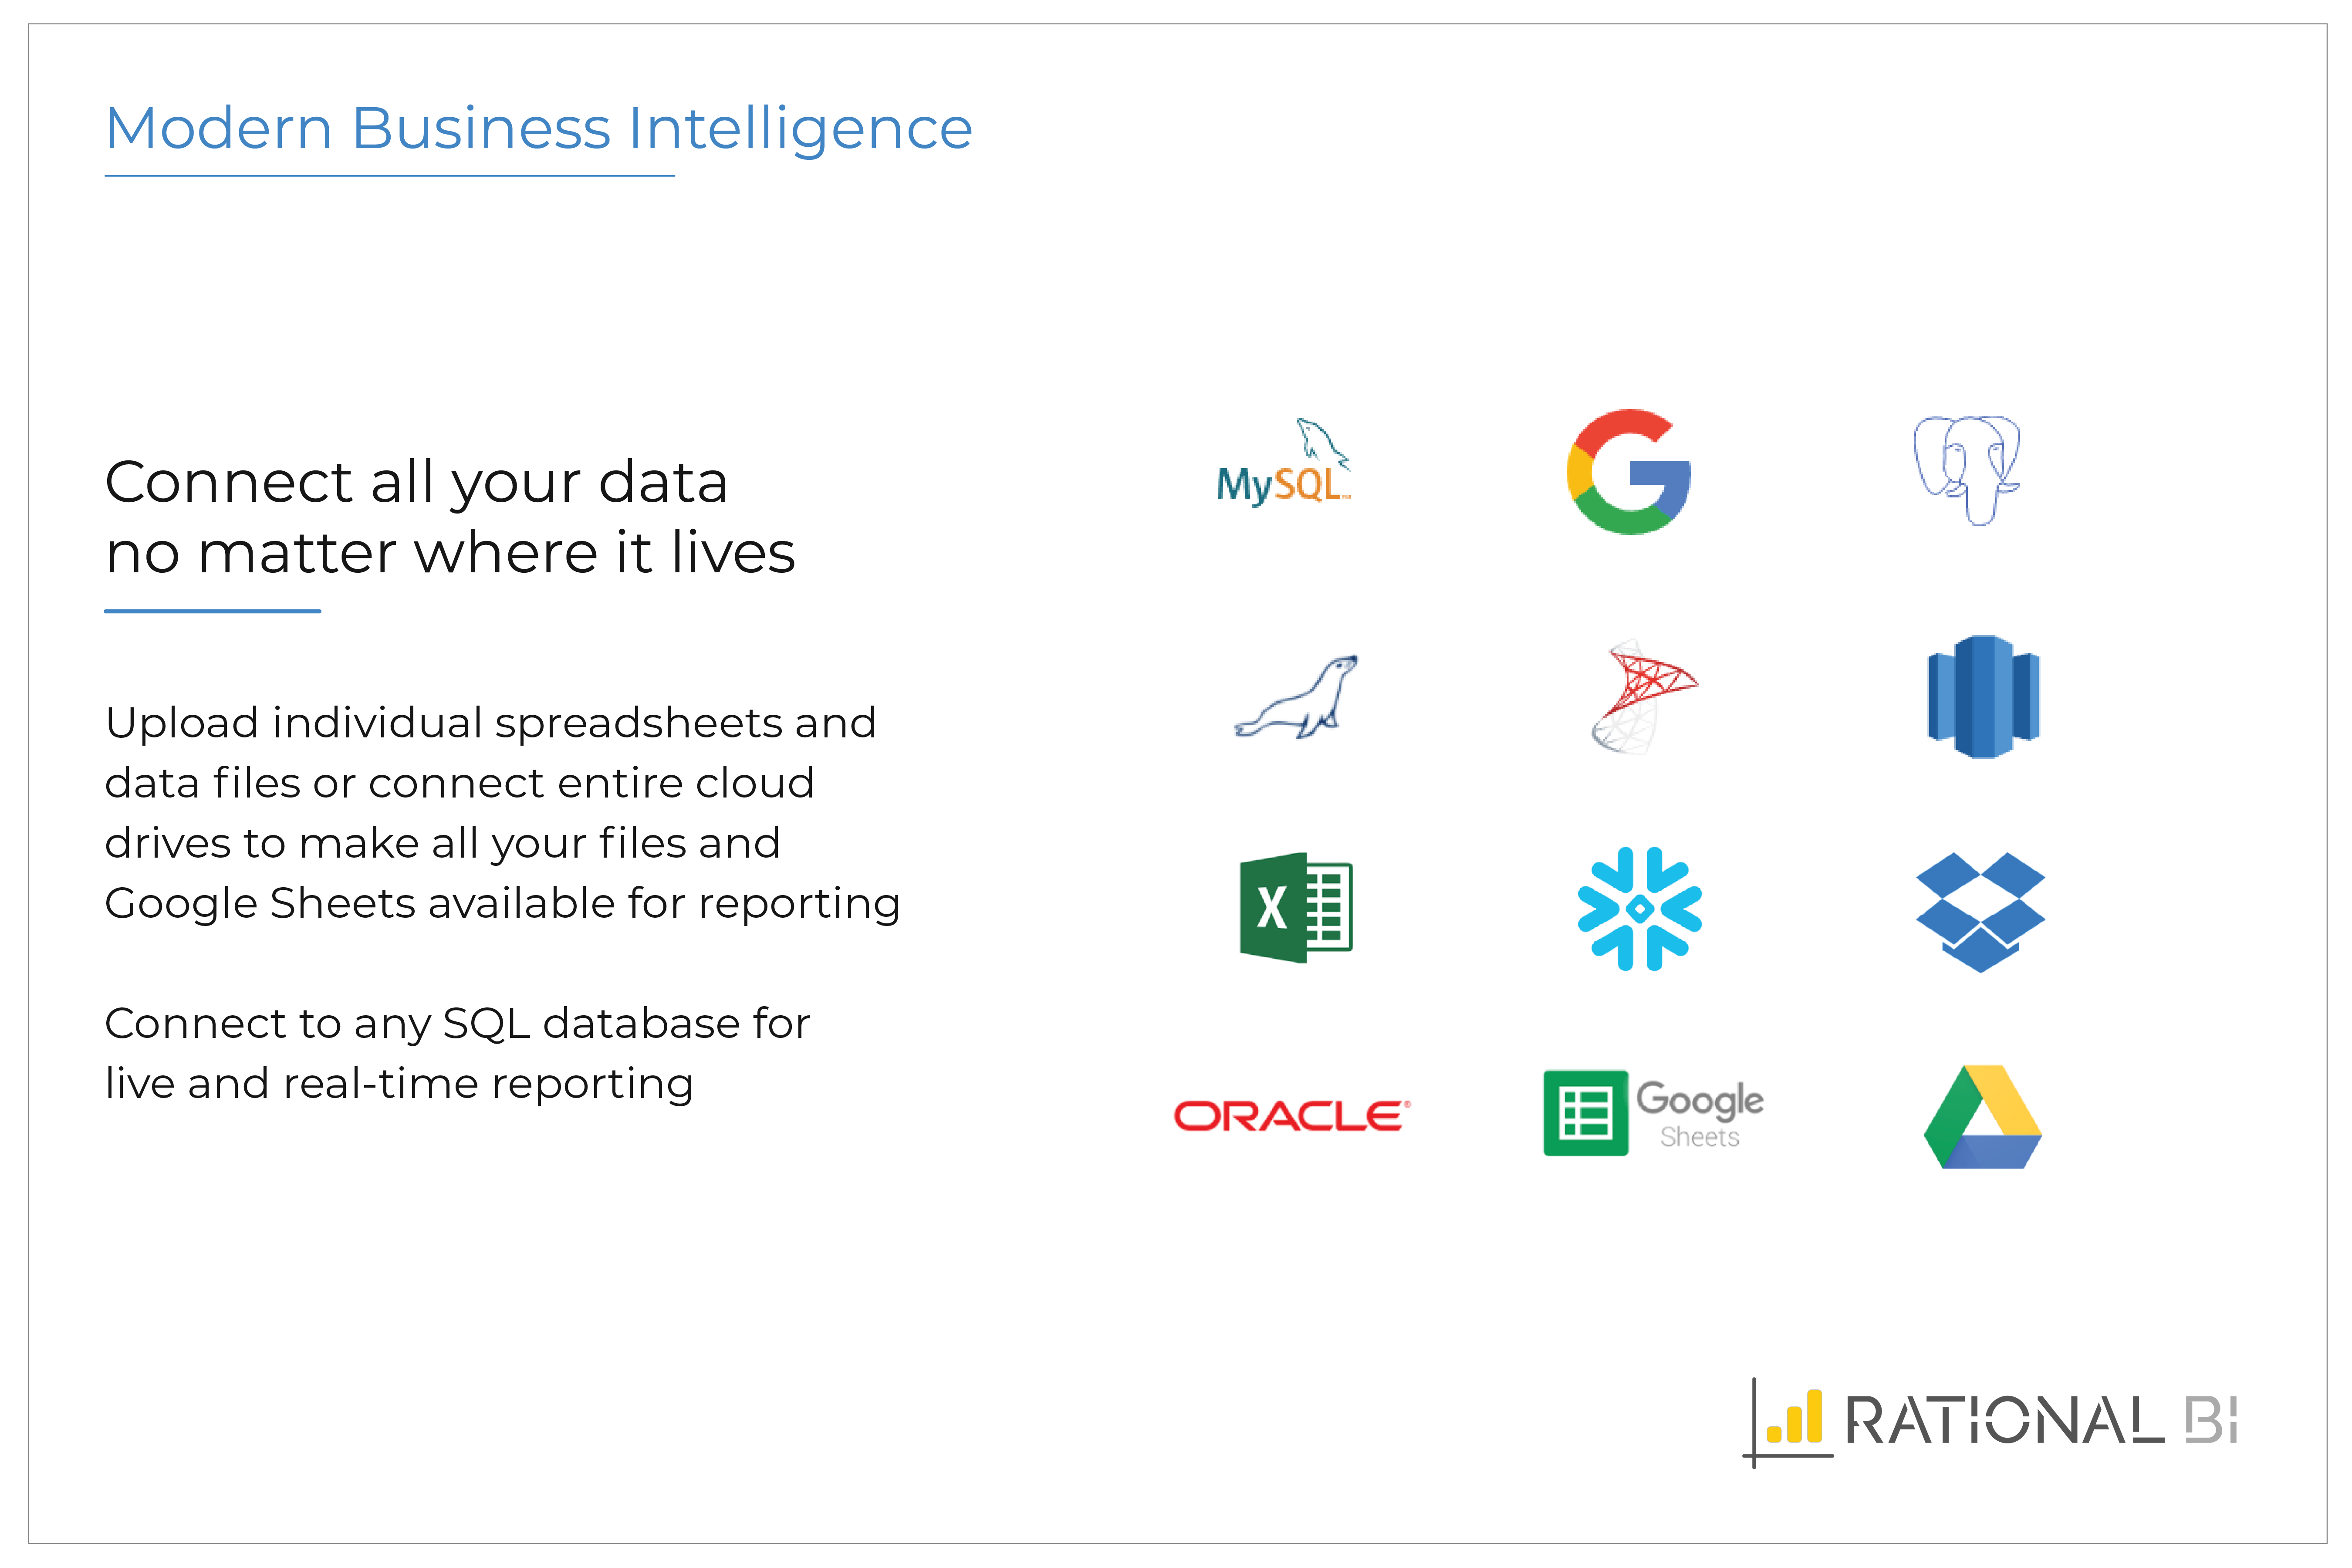 |