Chose Percona Monitoring and Management (PMM)
Vividcortex is nice but is costly.
Datadog loses for me on the UI front and, of course, it will be a charged product.
| Product | Rating | Most Used By | Product Summary | Starting Price |
|---|---|---|---|---|
 Percona Monitoring and Management (PMM) | N/A | Percona Monitoring and Management (PMM) is a free, open-source database monitoring and management solution. It helps enterprises reduce complexity and simplify management, while optimizing performance and improving the security of business-critical database environments - on-premises or in the cloud. It provides thorough time-based analysis for MySQL, PostgreSQL, and MongoDB servers to ensure that data works as efficiently as possible. PMM allows users to identify the issues that… | N/A | |
 SolarWinds Database Performance Monitor | N/A | VividCortex, acquired by SolarWinds in December 2019, provides database performance monitoring designed to increase system performance, team efficiency, and infrastructure cost savings. The GDPR- and SOC 2-compliant platform offers visibility into major open-source databases—MySQL, PostgreSQL, Amazon Aurora, MongoDB, and Redis—for the engineering team at scale. Industry leaders like Etsy, GitHub, SendGrid, and Yelp rely on Database Performance Monitor for all-query monitoring and drill… | N/A |
| Percona Monitoring and Management (PMM) | SolarWinds Database Performance Monitor | |||||||||||||||
|---|---|---|---|---|---|---|---|---|---|---|---|---|---|---|---|---|
| Editions & Modules | No answers on this topic | No answers on this topic | ||||||||||||||
| Offerings |
| |||||||||||||||
| Entry-level Setup Fee | No setup fee | No setup fee | ||||||||||||||
| Additional Details | Free and open-source | — | ||||||||||||||
| More Pricing Information | ||||||||||||||||
| Percona Monitoring and Management (PMM) | SolarWinds Database Performance Monitor | |
|---|---|---|
| Considered Both Products | Percona Monitoring and Management (PMM)  Rahul Maurya AWS Educate core team member Chose Percona Monitoring and Management (PMM) 1. SolarWinds Database Performance Monitor is a good choice but has its own costly price. Percona Monitoring and Management is stacking up against it in managing hundreds of databases and storing them. 2.Datadog is also paid plus not Open source. PMM is free open source and …  Miklos Szel Senior Database Architect Chose Percona Monitoring and Management (PMM) VividCortex is really excellent when it comes to query analysis, but it's pricy and on-premises sample collection is more problematic. When you have hundreds of machines and you even need to store the monitoring metadata locally, PMM is an excellent choice. If you are mainly …  Anil Yadav Senior Engineering Manager (Site Reliability Engineering) Chose Percona Monitoring and Management (PMM) | SolarWinds Database Performance Monitor No answer on this topic |
| Percona Monitoring and Management (PMM) | SolarWinds Database Performance Monitor | |
|---|---|---|
| Small Businesses | No answers on this topic | No answers on this topic |
| Medium-sized Companies |  LogicMonitor Score 9.0 out of 10 | LogicMonitor Score 9.0 out of 10 |
| Enterprises | LogicMonitor Score 9.0 out of 10 | LogicMonitor Score 9.0 out of 10 |
| All Alternatives | View all alternatives | View all alternatives |
| Percona Monitoring and Management (PMM) | SolarWinds Database Performance Monitor | |
|---|---|---|
| Likelihood to Recommend | 8.2 (7 ratings) | 8.0 (1 ratings) |
| Usability | 7.3 (4 ratings) | - (0 ratings) |
| Support Rating | 9.1 (3 ratings) | - (0 ratings) |
| Percona Monitoring and Management (PMM) | SolarWinds Database Performance Monitor | |
|---|---|---|
| Likelihood to Recommend | Percona
 Delphine Jakab Senior Business Controller | SolarWinds
 Mike Maner Network Systems Engineer |
| Pros | Percona
 Jose Manuel Ortega Software Engineer && Security researcher | SolarWinds
Mike Maner Network Systems Engineer |
| Cons | Percona
Delphine Jakab Senior Business Controller | SolarWinds
Mike Maner Network Systems Engineer |
| Usability | Percona
Rahul Maurya AWS Educate core team member | SolarWinds No answers on this topic |
| Support Rating | Percona
Miklos Szel Senior Database Architect | SolarWinds No answers on this topic |
| Alternatives Considered | Percona
| SolarWinds
Mike Maner Network Systems Engineer |
| Return on Investment | Percona
Delphine Jakab Senior Business Controller | SolarWinds
Mike Maner Network Systems Engineer |
| ScreenShots | Percona Monitoring and Management (PMM) Screenshots    | SolarWinds Database Performance Monitor Screenshots  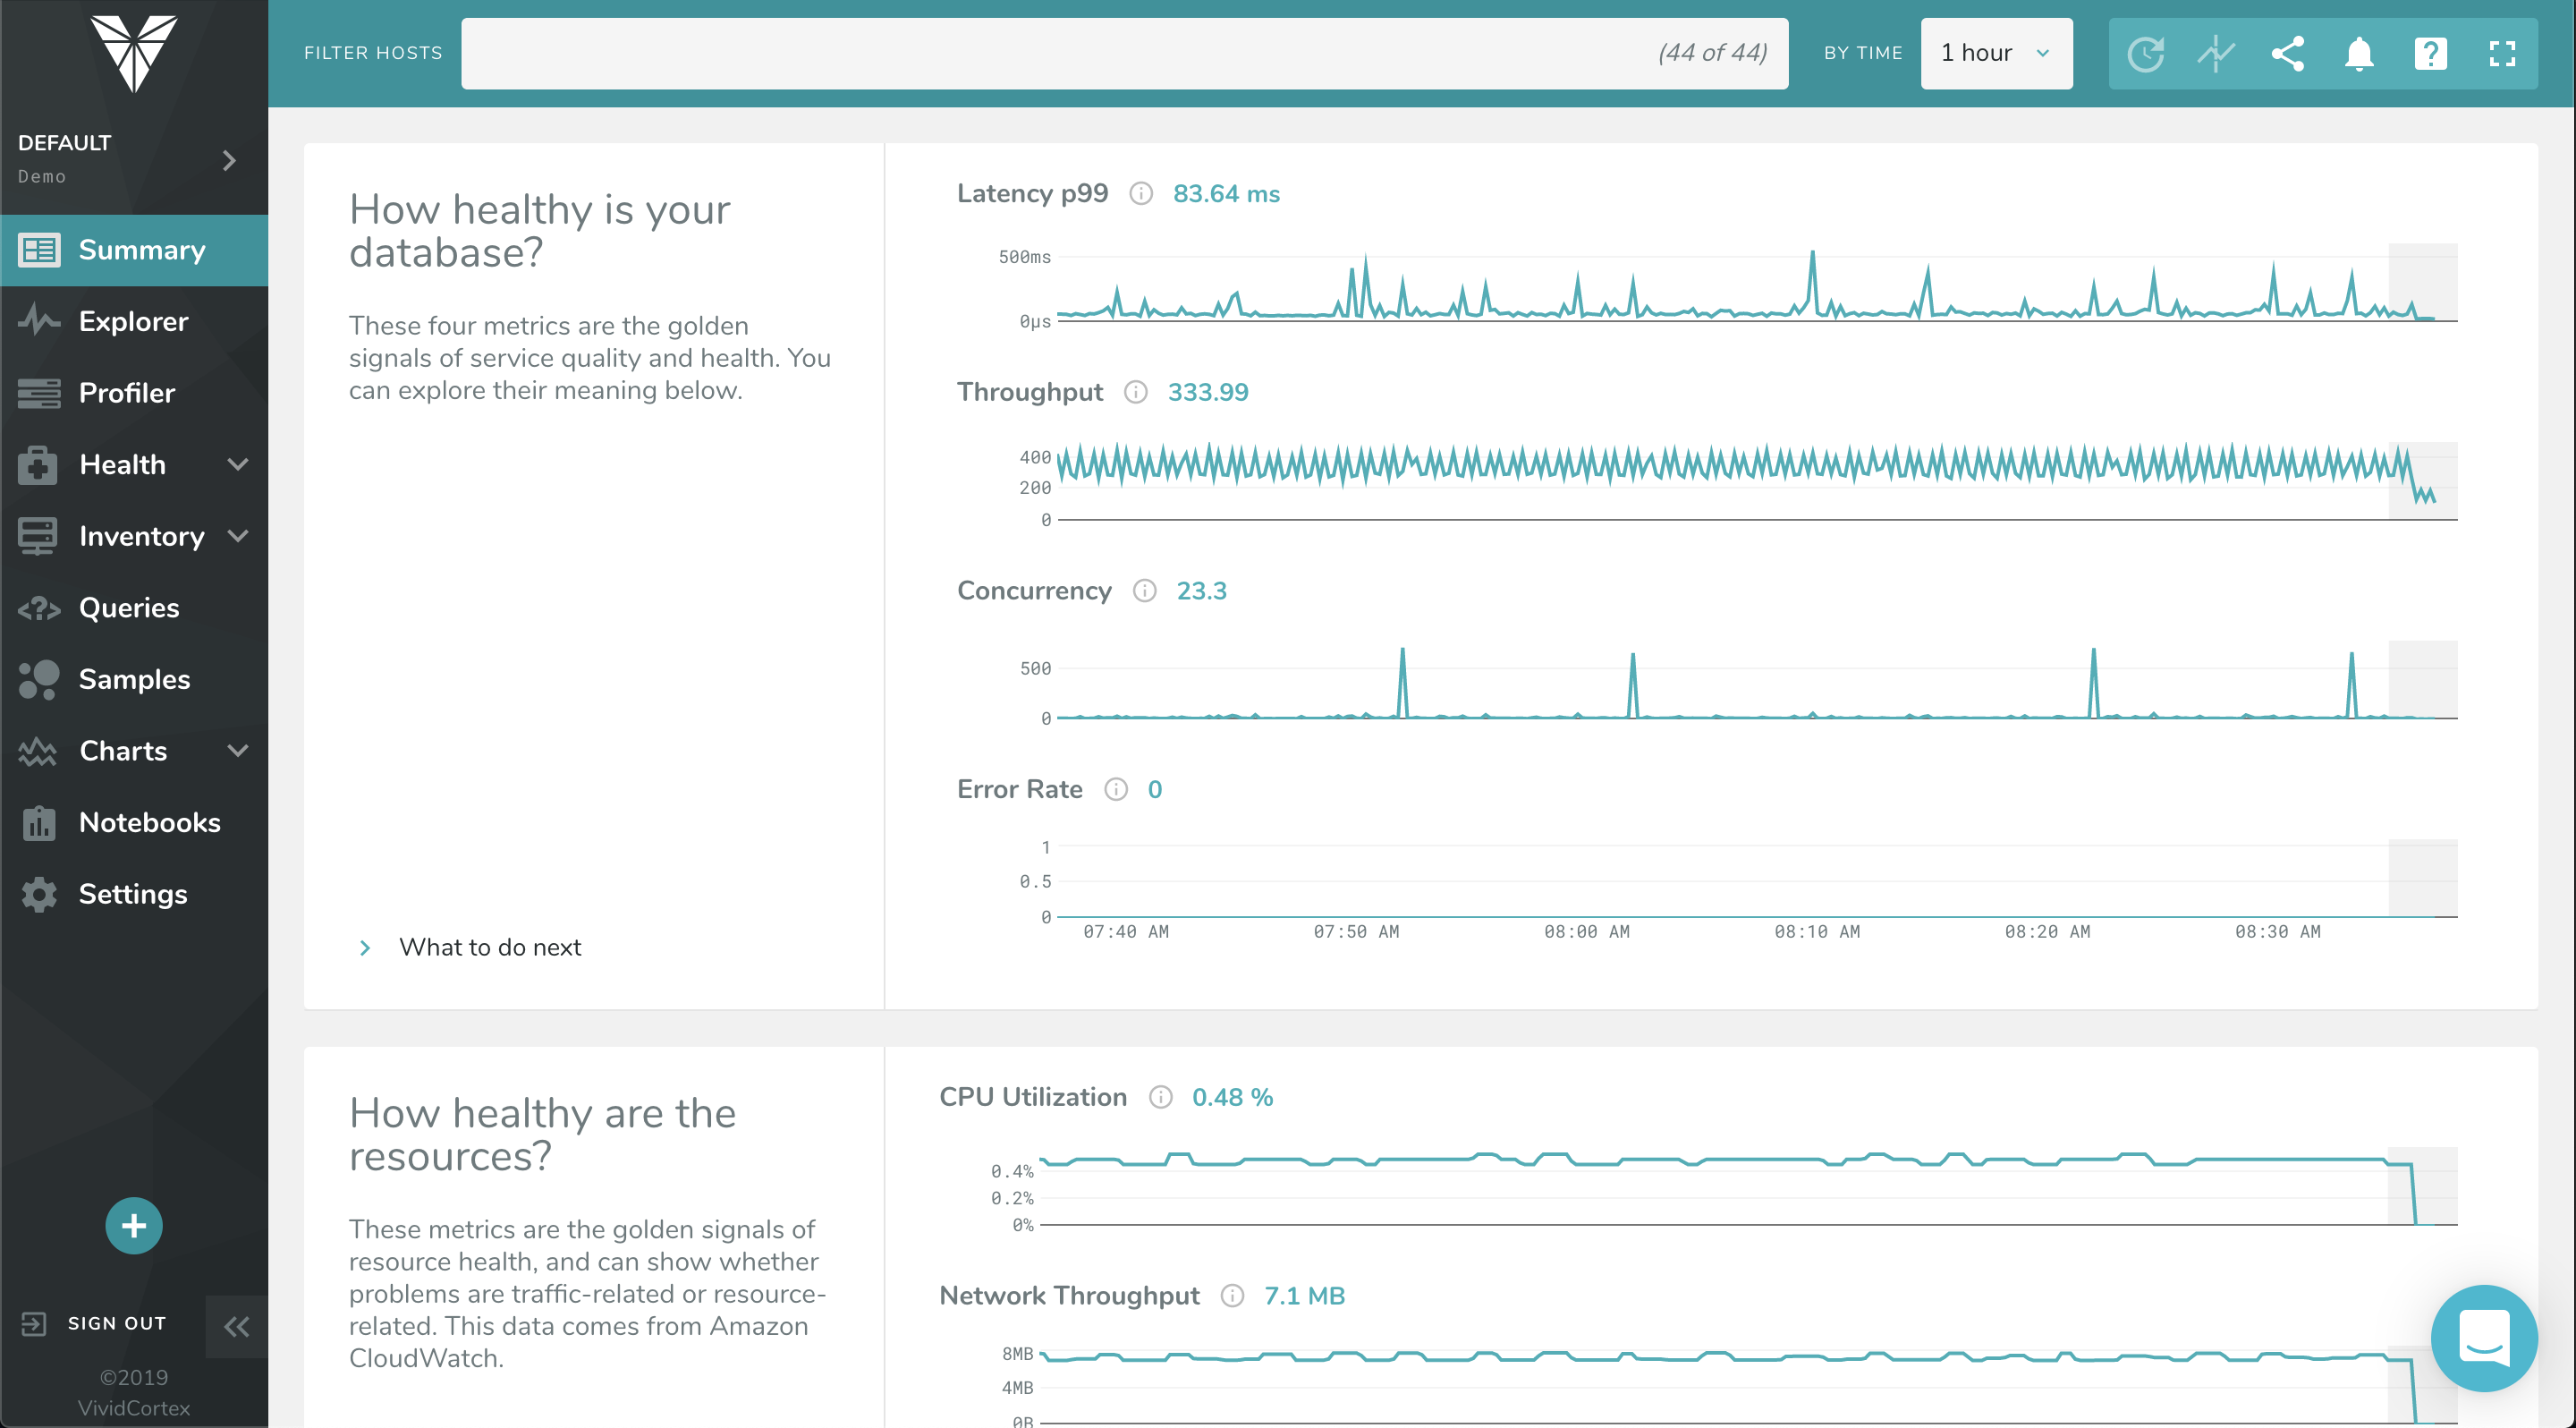  |