QGIS (formerly Quantum GIS) is a free and open source geographic information system.
N/A
QlikView
Score8.4 out of 10
N/A
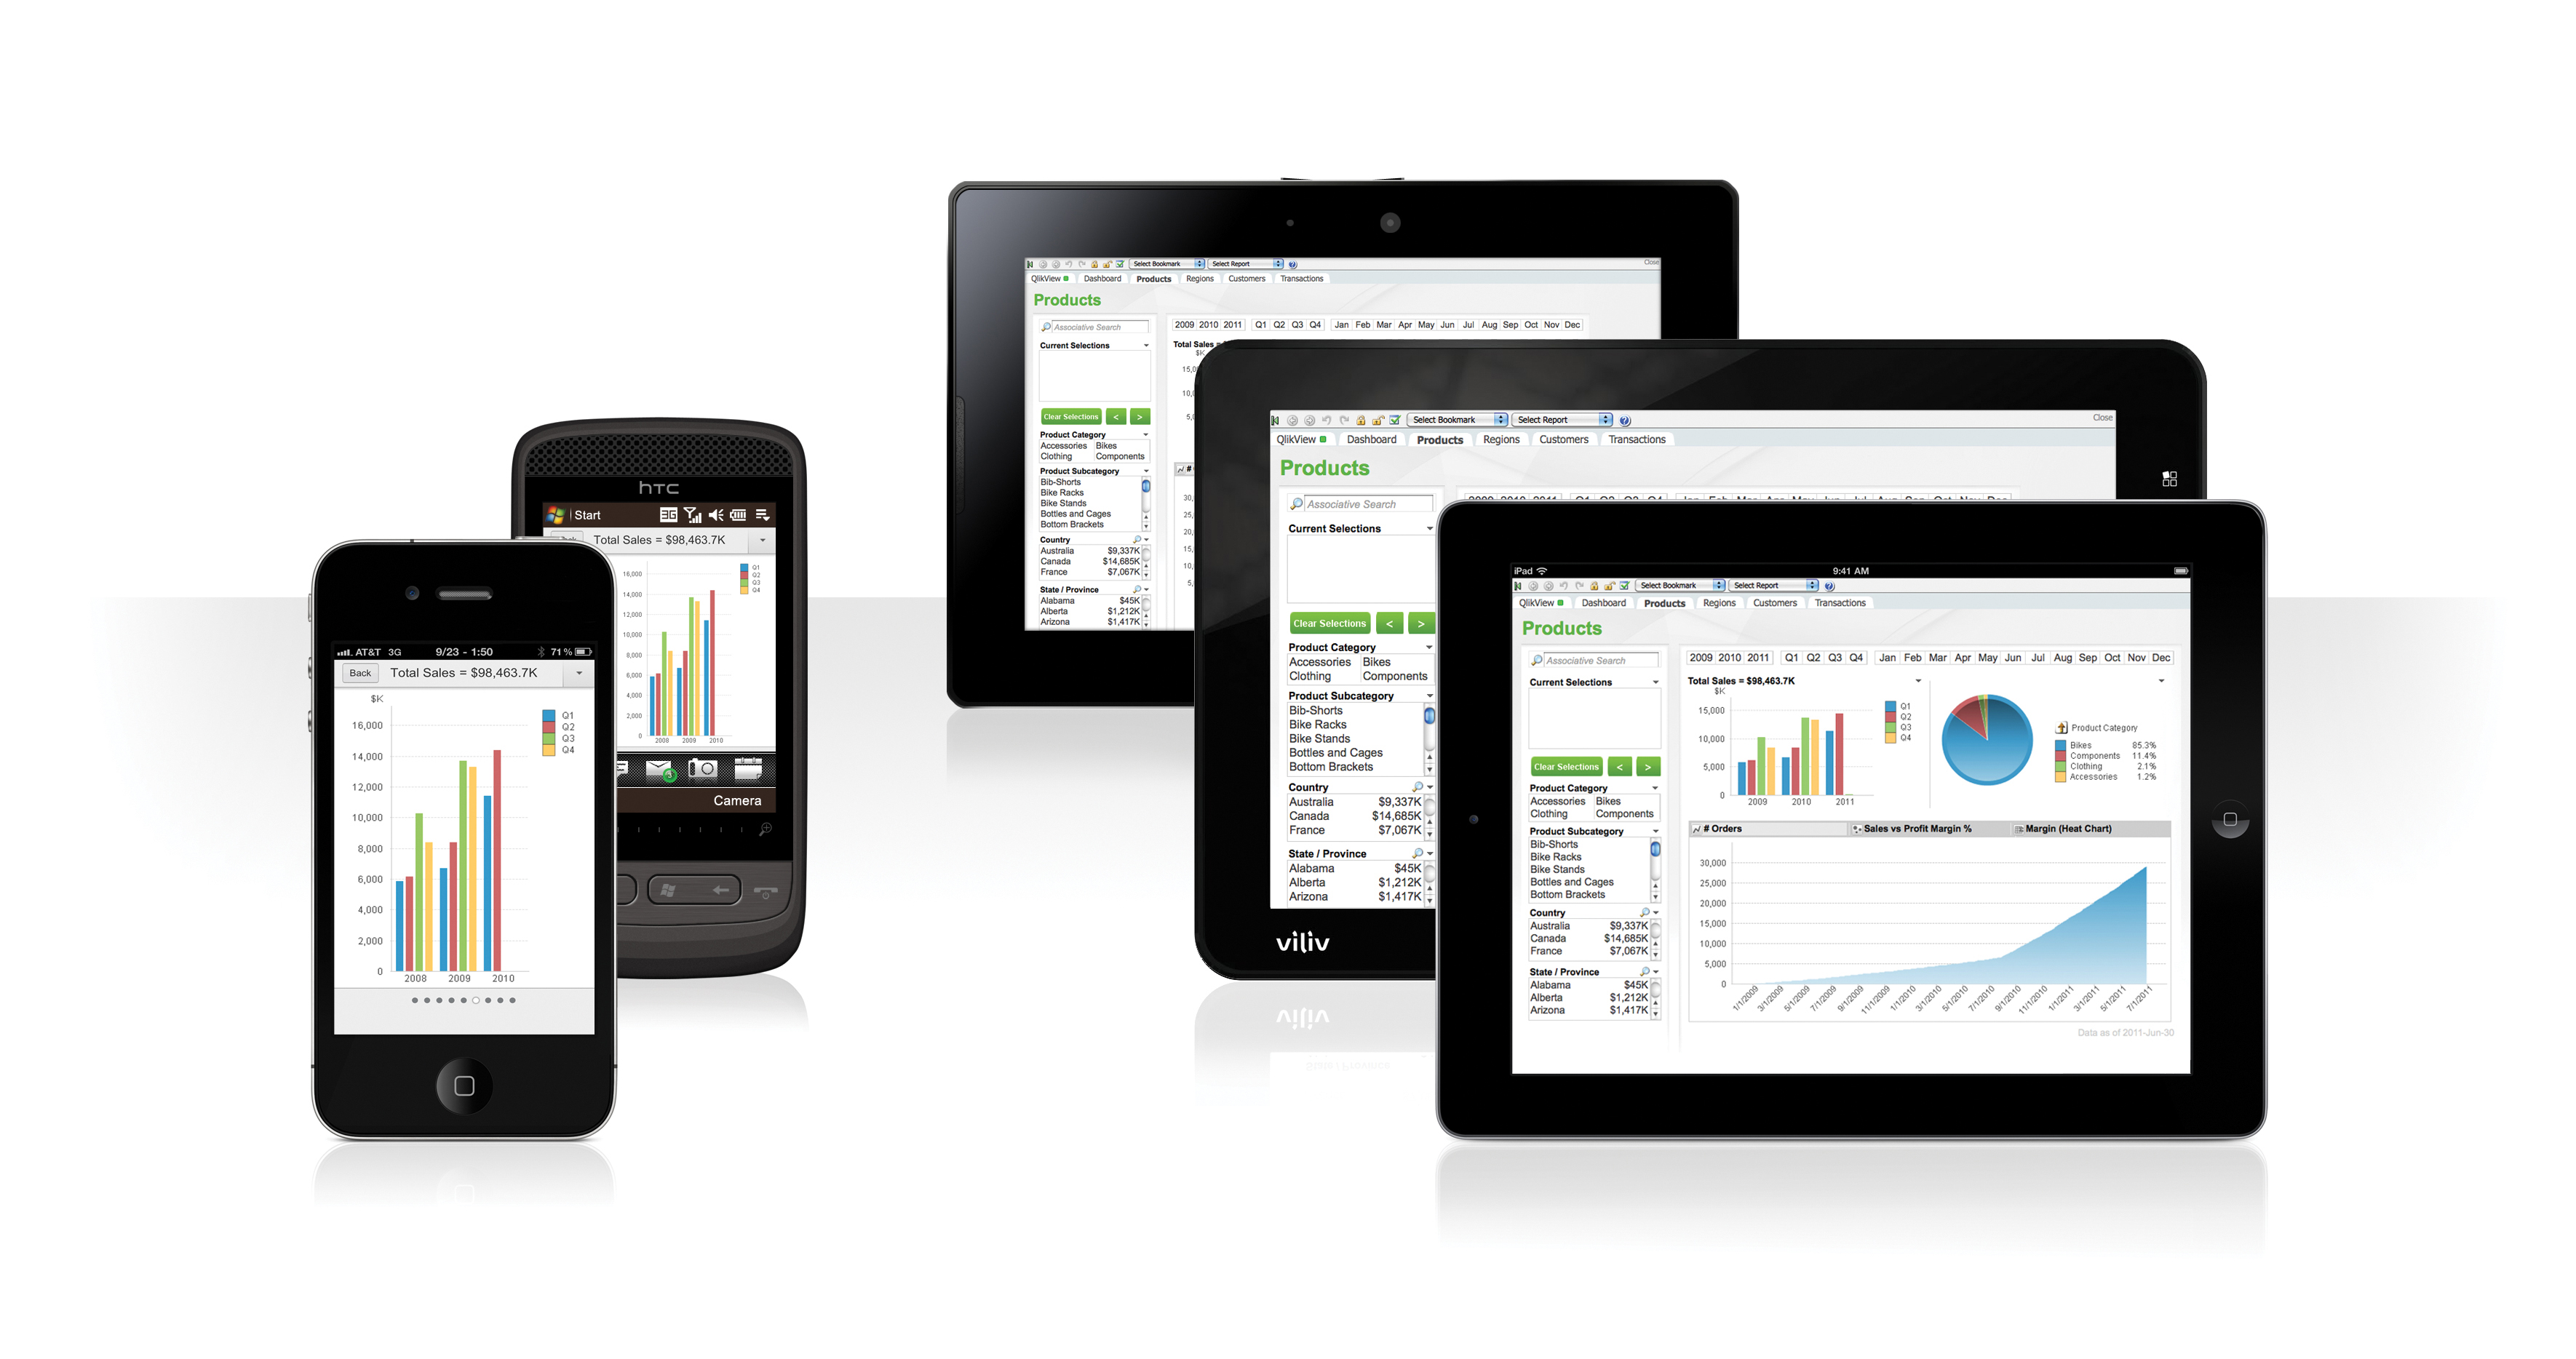
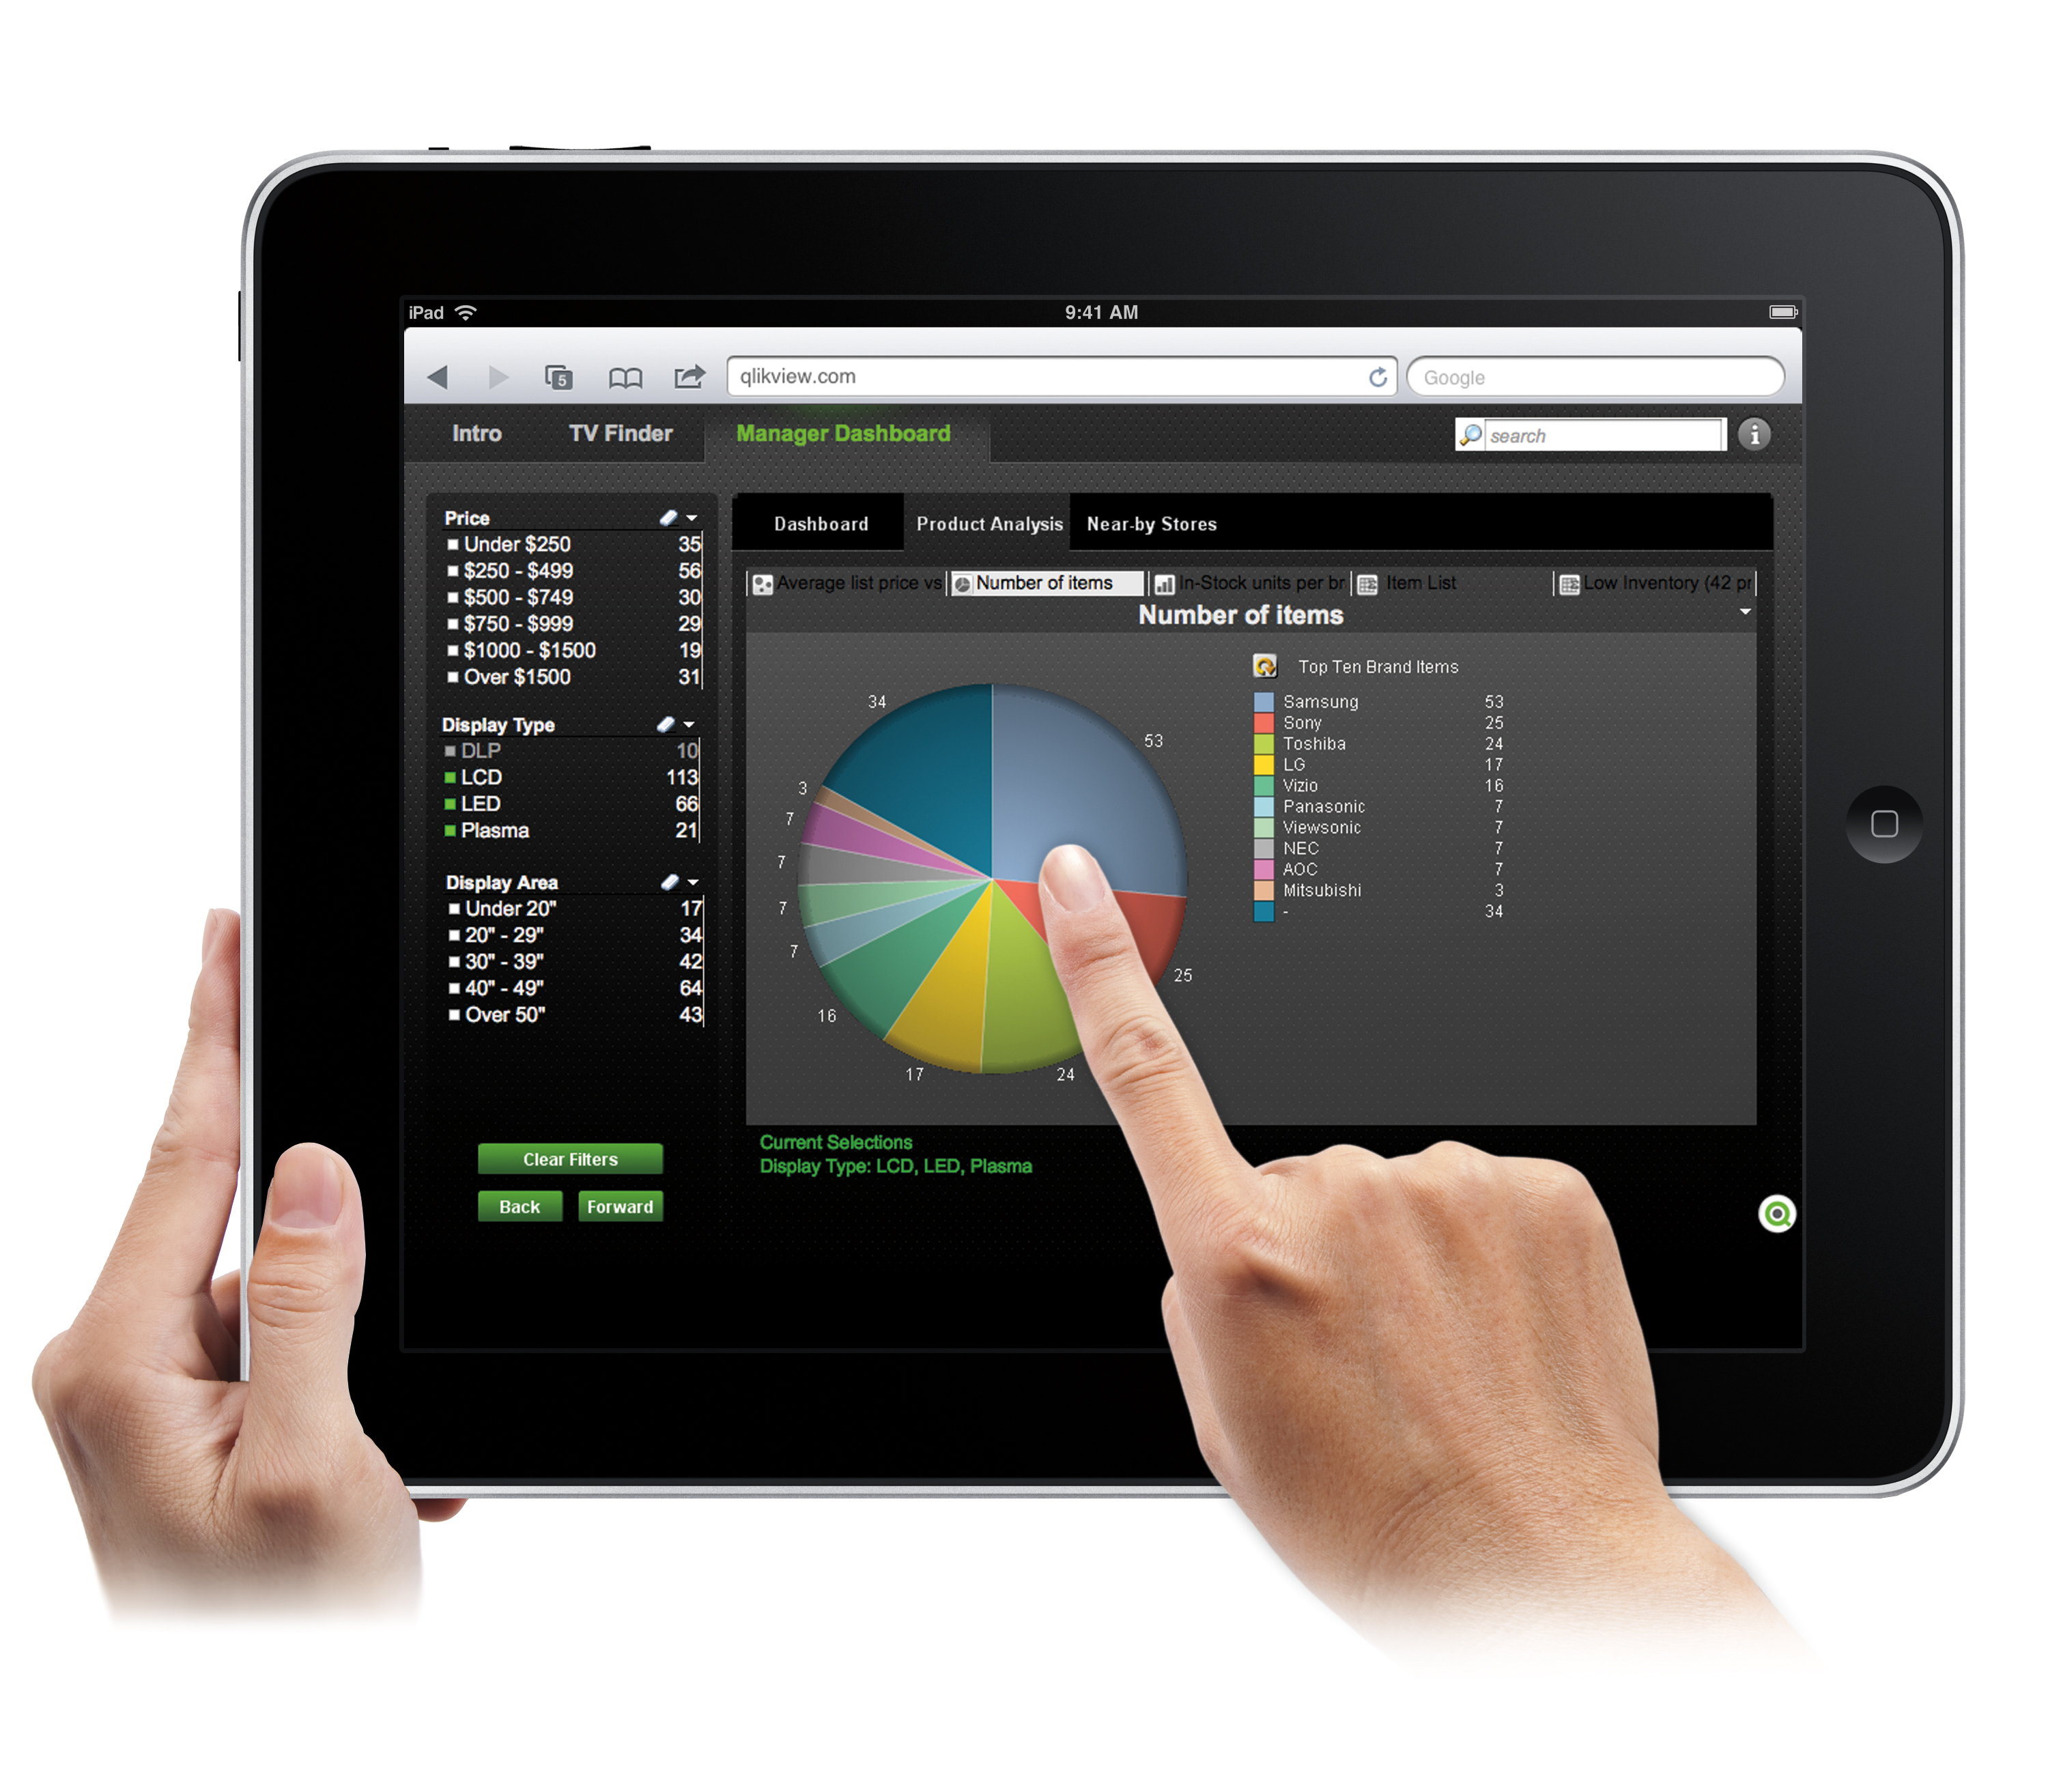
QlikView® is Qlik®’s original BI offering designed primarily for shared business intelligence reports and data visualizations. It offers guided exploration and discovery, collaborative analytics for sharing insight, and agile development and deployment.
N/A
Pricing
QGIS
QlikView
Editions & Modules
QGIS
Free
QlikView
Custom
per user
Offerings
Pricing Offerings
QGIS
QlikView
Free Trial
No
Yes
Free/Freemium Version
Yes
No
Premium Consulting/Integration Services
No
Yes
Entry-level Setup Fee
No setup fee
Optional
Additional Details
—
On an perpetual license basis, based on server plus number of users.
Contact vendor for pricing.
A de minimis incentive was given to thank the reviewer for their time. The incentive was not used to bias or drive a particular response, nor was the incentive contingent on a positive endorsement. More Info
Sales data validations have helped manage our justifications in the past, especially with regard to new product development and new business introduction. It has also been helpful in identifying trends with business impact and direction specific to quarter and monthly sales from ERP data as well as decisions to purchase equipment of staffing based on run rates and product demand.
One thing that can get out of hand is data output - if you aren't careful in your query, you may be overloaded with data dumps and drown in the amount of info you have to filter through. This is a user caution, not a comment on the software itself.
A de minimis incentive was given to thank the reviewer for their time. The incentive was not used to bias or drive a particular response, nor was the incentive contingent on a positive endorsement. More Info
Styling: the styling engine is fantastic with raster styling features that I recognize from apps like Photoshop.
Print layouts: I can set up custom print layouts, and even do automated multi-page atlas style reports that I use for cycling through detailed areas when providing my clients with pdf reports.
Extendable: the plugins are fantastic, and almost anything I need that isn't provided natively with QGIS is available as a plugin.
Community: the QGIS community is passionate about GIS, and are always ready to help. There are great training resources available online.
A de minimis incentive was given to thank the reviewer for their time. The incentive was not used to bias or drive a particular response, nor was the incentive contingent on a positive endorsement. More Info
A de minimis incentive was given to thank the reviewer for their time. The incentive was not used to bias or drive a particular response, nor was the incentive contingent on a positive endorsement. More Info
Making maps in QGIS is a bit clunky. I also find it to be extremely unintuitive. For basic GIS, it is great, but I would much rather make maps (for publication purposes) in ArcGIS.
Editing and adding feature layers is not very intuitive. Changing colors of added point or line features is a rather convoluted process.
ArcGIS has a huge selection of online courses, and if you have the appropriate license, you can access most for free. I found these to be very helpful when dealing with map projections and other issues. However, QGIS does not have a large library of courses specifically made for that program.
A de minimis incentive was given to thank the reviewer for their time. The incentive was not used to bias or drive a particular response, nor was the incentive contingent on a positive endorsement. More Info
We found that QlikView can be a bit slow in supporting some forms of encryption. It is web-based and we needed to upgrade all of our server to not support the older SSL and TLS 1 protocols, only support TLS 1.2 and TLS 1.3. However, QlikView could not run with TLS 1.2 and TLS 1.3. We had to wait over six months to get a version that would handle the newer TLS versions.
There are so many options with QlikView that you can get lost when developing a visualization. There are still items I have not yet figured out, such as labeling a graph with the name of a selected detail item.
QlikView works by pulling the data it is going to use for visualization into its database. I am a security reviewer and I need to make certain that PII and PHI is not pulled by QlikView for a visualization, otherwise this could become a reportable indecent.
A de minimis incentive was given to thank the reviewer for their time. The incentive was not used to bias or drive a particular response, nor was the incentive contingent on a positive endorsement. More Info
Ease of use, ability to load from pretty much any data source. today I created an application that loaded time sheets from excel that are not in a table format. With Qlik's "enable transformation steps" I was able to automate loads of multiple spreadsheets and multiple tabs easily. Could not do that with any other tool.
A de minimis incentive was given to thank the reviewer for their time. The incentive was not used to bias or drive a particular response, nor was the incentive contingent on a positive endorsement. More Info
I wasn't a GIS user at all when I started using QGIS, nor did I have any background working with data in anything other than Excel, and as a result, I struggled quite a lot in the beginning (it's not quite Google Maps). But having said that, I haven't come across anything that I couldn't do with a little help from the online community. I've done complex spatial analyses on large datasets of metropolitan cities, designed custom multi-page pdf reports that automatically cycle through different areas of an area, etc.
And the GIS staff that I've appointed, after their initial resistance, took to the tool like a fish to water, and I haven't heard them complain after starting to use the tool for a week or two.
But if you're new to GIS, be patient and invest some time to learn how to use the tool. It is absolutely worth it.
A de minimis incentive was given to thank the reviewer for their time. The incentive was not used to bias or drive a particular response, nor was the incentive contingent on a positive endorsement. More Info
QlikView is very easy to implement. The installation is very straight forward. QlikView has several different data connectors that can connect to different data sources very smoothly. The user interface to build the reports is very easy to understand. This helps to have a smaller learning curve. Something very helpful is that QlikView is a browser application for the end users. So, you don't need to install any applications on the user's computer.
A de minimis incentive was given to thank the reviewer for their time. The incentive was not used to bias or drive a particular response, nor was the incentive contingent on a positive endorsement. More Info
Even though there is a no dedicated support team for QGIS (or at least we are not aware of it), there is a huge online community and a large number of forums catering to every question you may have regarding any particular functionality of QGIS. So, you have a lot of help available but you will have to sift through it on the web.
A de minimis incentive was given to thank the reviewer for their time. The incentive was not used to bias or drive a particular response, nor was the incentive contingent on a positive endorsement. More Info
My experience with the Qlik support team has been somewhat limited, but every interaction I have had with them has been very professional and I received a response quickly. Typically if there is a technical issue, our IT team will follow up. My inquiries are specific to product functionality, and Qlik has been very helpful in clarifying any questions I might have.
A de minimis incentive was given to thank the reviewer for their time. The incentive was not used to bias or drive a particular response, nor was the incentive contingent on a positive endorsement. More Info
My team attended, but I cannot myself rate, but I think it was good as they've successfully launched a training program at our company themselves for users. It was 3-4 day training.
Training was as expected. The demo environments tend to be more fully featured that our own environment, but the training was clear and well delivered.
"Implementation" can mean a few things... so I'm not sure that this is the answer you want.... but here it goes: To me, implementation means: "Is the user interface intuitive and can I produce meaningful reports with ease?" On that score, I'd say YES. The amount of training required was minimal and the results were powerful. The desktop implementation is a simple, "blank" interface just waiting for your creativity. The pre-populated templates give you a reasonable start to any project -- and a good set of objects to "play around with" if you're just getting started. Finally, note that the "implementation" I used was baked into QuickBooks 2016 Enterprise -- called "Advanced Reporting"..... That integration makes it ultra useful and simple.
A de minimis incentive was given to thank the reviewer for their time. The incentive was not used to bias or drive a particular response, nor was the incentive contingent on a positive endorsement. More Info
QGIS is open source and freely available for Windows and Mac iOS Geographic Information System Software. QGIS is highly customizable as per project requirements and different application usage. QGIS has ample tools and plugins that are useful for the analysis of raster and vector data. It also supports GRASS, GDAL, and SAGA tools.
A de minimis incentive was given to thank the reviewer for their time. The incentive was not used to bias or drive a particular response, nor was the incentive contingent on a positive endorsement. More Info
The only other vendor product that I have worked with that provides a similar experience to Qlikview is Tableau. I would recommend Tableau if your use case is to build a fixed dashboard. You can share reports for free without needing to buy additional licenses. I would recommend Qlikview if your users are looking for a more interactive experience. They can create new objects to represent the data which can't be accomplished as easily in Tableau
A de minimis incentive was given to thank the reviewer for their time. The incentive was not used to bias or drive a particular response, nor was the incentive contingent on a positive endorsement. More Info
QGIS gives us more impactful data on children and maternal health issues, which in turn has helped us establish more programs, relationships, and funding opportunities because of the excellent data presentations we can give.
QGIS has allowed our staff to improve their data analysis skills, improving our workforce across the board, with or without the direct use of geographic data.
QGIS has required a lot of staff time to learn, but the ROI on time spent vs the reports we produced afterward has been well worth it.
A de minimis incentive was given to thank the reviewer for their time. The incentive was not used to bias or drive a particular response, nor was the incentive contingent on a positive endorsement. More Info
You can use the free desktop version to do a lot of reporting and analysis work more quickly so the ROI is huge
QlikView is great at finding outliers such as data entry errors
QlikView is great at helping you quickly discover new insights about your business that can prompt you to take action that can immediately affect your cash flow.
A de minimis incentive was given to thank the reviewer for their time. The incentive was not used to bias or drive a particular response, nor was the incentive contingent on a positive endorsement. More Info