
Sisense for Cloud Data Teams vs. Spoom
| Product | Rating | Most Used By | Product Summary | Starting Price |
|---|---|---|---|---|
 Sisense for Cloud Data Teams | Score5 out of 10 | N/A | Sisense for Cloud Data Teams (formerly Periscope Data) is a data visualization tool that allows users to connect to their SQL databases to create sharable, interactive dashboards. In addition to SQL, its analytics integrate with R and Python, allowing users to prep datasets, perform analysis, and create their own visualizations. Sisense acquired Periscope Data in mid-2019. | N/A |
 Spoom | Score8 out of 10 | Mid-Size Companies (51-1,000 employees) | Spoom (formerly Analyza) is a business intelligence solution that is provided by Spoom Software (formerly PIT Business). The vendor provides support services in Luxembourg, Belgium, France, and other parts of Europe. Spoom allows users to: Build several indicators and dashboards Build ad-hoc analysis without IT knowledge Navigate through data via drill-down and filtering Schedule reports and send results by mail or to external… | N/A |
| Sisense for Cloud Data Teams | Spoom | |||||||||||||||
|---|---|---|---|---|---|---|---|---|---|---|---|---|---|---|---|---|
| Editions & Modules | No answers on this topic |
| ||||||||||||||
| Offerings |
| |||||||||||||||
| Entry-level Setup Fee | No setup fee | $15,000 per installation (including licences and maintenance for 3 years) | ||||||||||||||
| Additional Details | — | The On-Premise or SaaS solutions are the same price; we provide a dedicated machine or virtual machine for both. For 10 users, the budget is from $15,000 to $90,000 for a full Business Intelligence solution (including licenses and maintenance for 3 years). The installation and configuration cost depends on customer's data architecture, volume and number of sources. It also depends on customizations required (i.e.: exporting pixel to pixel PDF files to a SharePoint platform). | ||||||||||||||
| More Pricing Information | ||||||||||||||||
| Sisense for Cloud Data Teams | Spoom | |||||||||||||||||||
|---|---|---|---|---|---|---|---|---|---|---|---|---|---|---|---|---|---|---|---|---|
| BI Standard Reporting |
| |||||||||||||||||||
| Ad-hoc Reporting |
| |||||||||||||||||||
| Report Output and Scheduling |
| |||||||||||||||||||
| Data Discovery and Visualization |
| |||||||||||||||||||
| Access Control and Security |
| |||||||||||||||||||
| Mobile Capabilities |
| |||||||||||||||||||
| Sisense for Cloud Data Teams | Spoom | |
|---|---|---|
| Small Businesses |  Chartio (discontinued) Score7.5 out of 10 | No answers on this topic |
| Medium-sized Companies |  Jet Reports Score9.5 out of 10 |  IBM Planning Analytics Score8.5 out of 10 |
| Enterprises |  Kibana Score8.4 out of 10 |  Oracle Fusion Cloud Enterprise Performance Management Score7.2 out of 10 |
| All Alternatives | View all alternatives | View all alternatives |
| Sisense for Cloud Data Teams | Spoom | |
|---|---|---|
| Likelihood to Recommend | 4.0 | 8.2 |
| Usability | 8.0 | - |
| Support Rating | 6.9 | - |
| Data Sharing and Collaboration | 9.0 | 8.2 |
| Data Sources | 9.0 | 9.1 |
| Sisense for Cloud Data Teams | Spoom | |
|---|---|---|
| Likelihood to Recommend |
|
|
| Pros |
|
|
| Cons |
|
|
| Usability |
| No answers on this topic |
| Support Rating |
| No answers on this topic |
| Alternatives Considered |
|
|
| Return on Investment |
| No answers on this topic |
| ScreenShots | Spoom Screenshots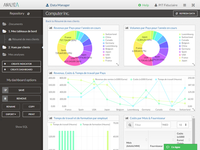 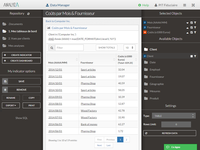  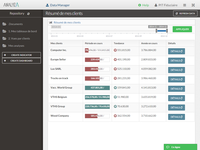   |



