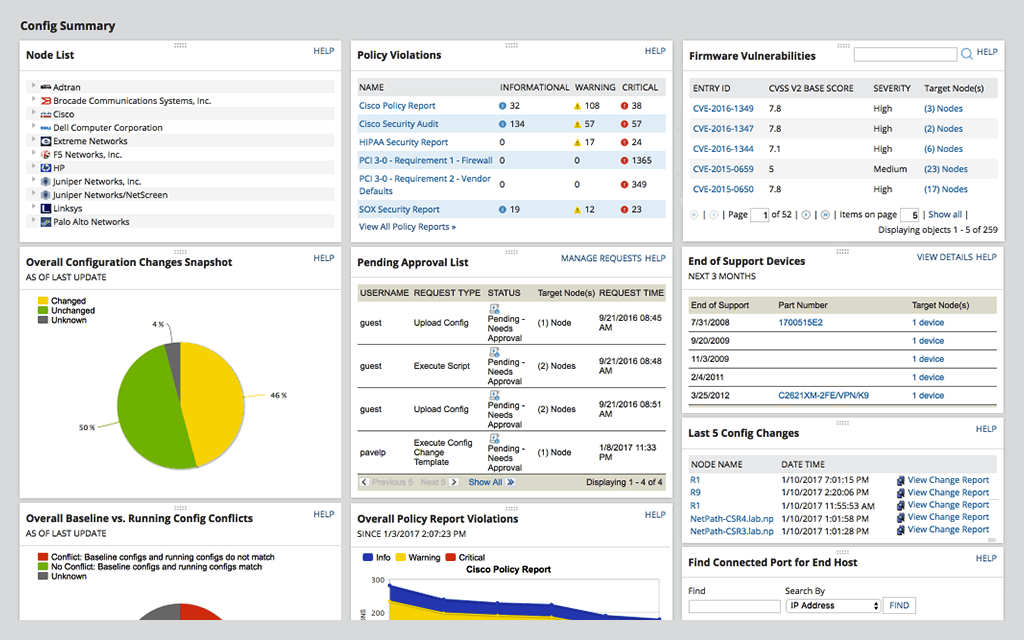
SolarWinds Network Configuration Manager is network diagnostics and troubleshooting technology, from Austin-based SolarWinds.
N/A
Zabbix
Score 8.8 out of 10
N/A
Zabbix is an open-source network performance monitoring software. It includes prebuilt official and community-developed templates for integrating with networks, applications, and endpoints, and can automate some monitoring processes.
SolarWinds Network Configuration Manager has a quicker turn-up time then Ansible, but in the long term, Ansible will replace the core templating of Network Configuration Manager. We will keep the backup engine and software update feature in Network Configuration Manager, but …
The software's I mentioned are great, but they are overpriced comparing to Zabbix while it's a free open-source application. The value its adding has high price than any other free open-source apps. the monitoring and alerts details and the friendly user interface is stacking …
If your IT team isn't proficient in automation and scripting, Solarwinds NCM can fill that gap (assuming your company's security team signs off on approving SW in your environment given the hack.) Basic device configuration, pushing mass changes reliably and backups are NCM's strong suites. If you have a complex scenario where if/then cases are needed, NCM is a bit lack luster. Auto discovery isn't as easy either as certain parameters need to be met for that feature to work 100% of the time
Zabbix is great for monitoring your servers and seeing alerts when the system uses too much CPU or memory. This allowed the system Engineer to be proactive and add resources to these systems to avoid interrupting the services. Especially servers running operations applications and services. This is one of the best usages for Zabbix.
Collecting hardware data - CPU, Memory, Network, and Disk Metrics are collected and reported on.
Flexible design - It is very easy to build out even very large environments via the templating system. You can also start where you are - network monitoring, server monitoring, etc. and then build it out from there as time and resources permit.
Provides a "plugin architecture" (via XML templates) to allow end users to extend it to monitor all kinds of equipment, software, or other metrics that are not already added into the software already.
Very complete documentation. Almost every aspect of Zabbix has been documented and reported on.
Cost - Zabbix is FOSS software and always free. Support is reasonably priced and readily available.
For our use case, it does everything great and some of the features we underutilize but I would like to be able to set a configuration baseline when initially adding a node instead of after the configuration is pulled but it's not a particularly big deal to let it pull the configuration then set it as the baseline.
Medium complexity to set up in the beginning if using any non-standard devices or configurations, else fairly easy (e.g. Cisco Nexus or IOS-based devices). Reports are fairly straightforward to set up. Updates to the platform are fairly straightforward and don't take a major effort. Easy to add or remove devices.
It is free. It didn't cost anything to implement (other than my time and the cost incurred for it) and it is filling a badly needed gap in our IT infrastructure. Support is available if we have issues and can be done annually or paid for on a per incident basis as needed. Expansion, updates, and all other future lifecycle activities are likewise free of cost, so as long as someone is able to implement/maintain the software (and the OSS project is maintained) then I imagine the company will never leave it.
The user interface is lacking. It is difficult to navigate at times and things can be done multiple ways. Quite often I am confused by how their notification structure works. It is not very intuitive. They do offer a free Academy. They also offer a community of other technical folks. I have enjoyed both.
I think every organization, especially the IT department, needs a tool like this. I know of another product like Zabbix that gives a similar or the same solution, but its range makes it very useful. You can see almost all the device info in one place: disk usage, disk space, network usage, etc.
To be fair, I have not had to involve Support in a number of years, but when I did, I was greeted with enthusiastic engineers who wanted to understand and solve the issue. It was a fairly complex scenario and I have discovered in my most recent implementation that engineering included that option as a standard now.
The setup is the most time-consuming portion of using zabbix. It takes a lot of effort to shape it into a usable format and even then it can get very messy. It's not exactly intuitive and as mentioned the UI seems a bit antiquated. If I was to roll out a monitoring solution from scratch, I'd probably look for alternatives which are easier to use and maintain.
Solarwinds has actually produced new training since I last used it that is available on their site at any time. Their previous training was more than enough to get us started but now there is significantly more content. Since I'm comfortable with the Orion platform and the products we use I haven't checked the new training out yet but we have new staff go through portions of that training and they always come away with an understanding of the platform and ready to use it
it was a fairly easy implementation and everything was pretty straightforward. only challenge we had was getting all the snmp communities updated on the networking equipment
We are a mainly Windows environment, so it would be useful if we could have used Active Directory to deploy agents. As of version 4.2, Zabbix has announced a new agent MSI file to allow exactly that. Unfortunately, we didn't have that option. Also, for Linux and MAC deployments, there is no simple way to deploy that. Using remote scripts you may be able to create something, but most places will opt for either SNMP (agentless) or manual installation of agents to add to Zabbix. A way of deploying agents via discovery would go a long way to helping in the adoption of the tool.
Red Hat Ansible Automation Platform is a great tool and matches much of the functionality of SolarWinds Network Configuration Manager. Nothing about Ansible will likely be overwhelming to an engineer with a little time to spare, but that spare time combined with SolarWinds already being our monitoring tool made the decision easy. Time is at a premium in small teams and SolarWinds Network Configuration Manager is very easy to use right out of the box without all the tweaking required by powerful command line driven tools like Ansible.
We're using the Solarwinds suite as our global monitoring standard, but it is very complex and its licensing model makes it difficult to monitor a wide range of technologies. So, we're using Zabbix as a complement on our monitoring process. Zabbix is a way more flexible and has free integrations to a wide range of technologies. It is also more 'user friendly' and easy to manage.