TrustRadius: an HG Insights company

Lightning Tools Data Viewer

Score9.1 out of 10

1 Reviews and Ratings

What is Lightning Tools Data Viewer?

The Data Viewer provides data visualization in the form of reports or charts that can be created and customized to suit a business's needs. Silos of data exist in most organizations and yet contain valuable insights into how well the organization is performing and where action is needed. Those silos often include Microsoft Excel workbooks, Microsoft SQL Azure databases, On-Premises data sources accessible through OData or Business Connectivity Services and even SharePoint Lists. These data sources can be connected to, to produce reports displayed in SharePoint or Teams.

Categories & Use Cases

Media

DISPLAYING EXTERNAL DATA WITHIN SHAREPOINT OR MICROSOFT TEAMS
The Data Viewer Client Side Web Part can be configured by Business Users within a few minutes to display Line of Business Data from Data Sources such as Excel,  SQL Azure, Business Connectivity Services, OData and SharePoint Lists.  Connections to an organizations data such as Customer Relationship Management Systems, Accounting Systems, or Custom Databases can be connected, giving business users a live up-to-date view of business information within the context of their SharePoint Team Sites or Microsoft Teams Tabs.
HIGHLIGHTING KEY BUSINESS DATA (NO CODE)
Conditional formatting can be used to highlight key business data. Overdue Tasks, Low Stock, Currency Exchange Rates, Sales Revenue are examples of data to highlight visually allowing for a quick reaction time. Key Financial Indicators and Key Performance Indicators can be configured with a simple dialog and no need to write any code. Choose colours, icons or data bars to highlight key data.
SELECTING AND STYLING ICONS
Icons can be chosen as part of the conditional formatting to make data stand out. The Office 365 Fabric icons can be selected and styled and applied to cell values. Pepper pots, Smileys, Envelopes and more icons are available. There are hundreds of options to choose from to highlight data that needs to be acted upon.
DATA VIEWER CAN BE A GRID OF DATA OR A CHART IN SHAREPOINT OR MICROSOFT TEAMS
The Data Viewer can be used within Microsoft SharePoint Modern Sites or Microsoft Teams Tabs as a Grid of Data with styling or as a Chart which can be configured. The Charting Feature allows for Pie, Donut, Column, Line, Area, and Scatter Charts which can all be configured and displayed in 2D or 3D.
TREEMAPS
summary information can be displayed within a TreeMap next to the detail. Users will be able to see trends, and how the business is performing  using the TreeMap view of data.
CHARTS AND GAUGES
The Data Viewer is used to represent data in multiple ways using Gauges, TreeMaps, Multiple Series Charts, and Pie Charts.
BUILDING DASHBOARDS
The Data Viewer can be a grid view or a chart enabling users to build a dashboard within the context of a SharePoint Team Site or Microsoft Teams Tab.

1 / 7

Top Performing Features

  • Customizable dashboards

    Customizable dashboards are dashboards providing the builder some degree of control over the look and feel and display options.

    Category average: 8.1

  • Report Formatting Templates

    Category average: 7.7

  • Formatting capabilities

    Ability to format output e.g. conditional formatting, lines, headers, footers.

    Category average: 7.7

Areas for Improvement

  • Report sharing and collaboration

    Report sharing and collaboration is the ability to easily share reports with others.

    Category average: 8.3

  • Drill-down analysis

    Drill down analysis is the ability to get to a further level of detail by going deeper into the hierarchy.

    Category average: 7.6

  • Pre-built visualization formats (heatmaps, scatter plots etc.)

    Pre-built visualization formats are canned visualization types that can be selected to visualize different kinds of data.

    Category average: 8

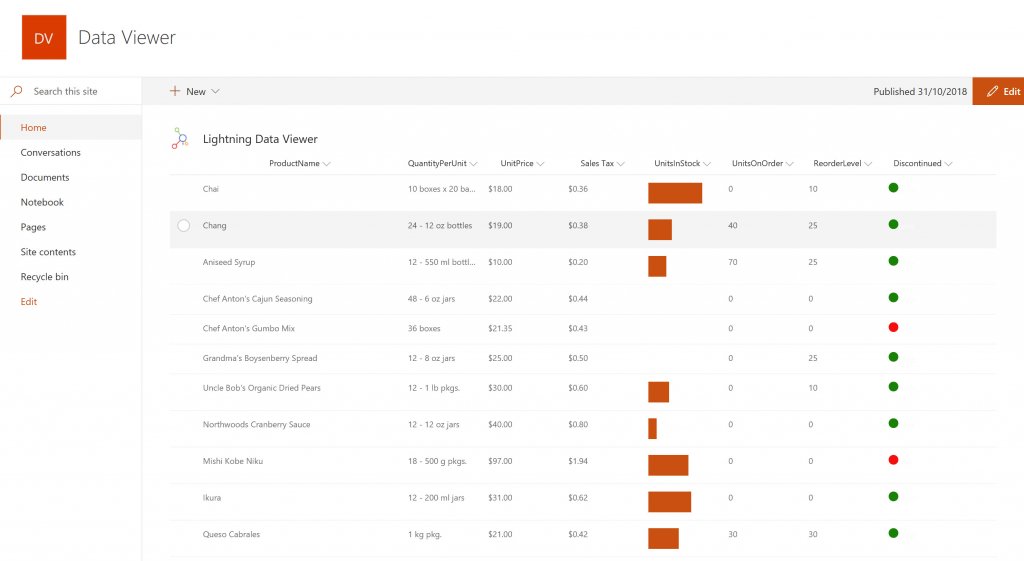
Data Viewer by Lightning Tools is indespensible for re-surfacing data from other SharePoint places or sites online

Use Cases and Deployment Scope

We have over 16 SharePoint Online sites. Lightning Tools DataViewer allows me to resurface a list from one site to others where users need to see that information on their main page. Lightning Tools DataViewer is absolutely essential for doing that. SharePoint's built-in viewer is very limited.

Pros

  • Shows Lists created on different sites to be seen and controlled on another site in a Tenant
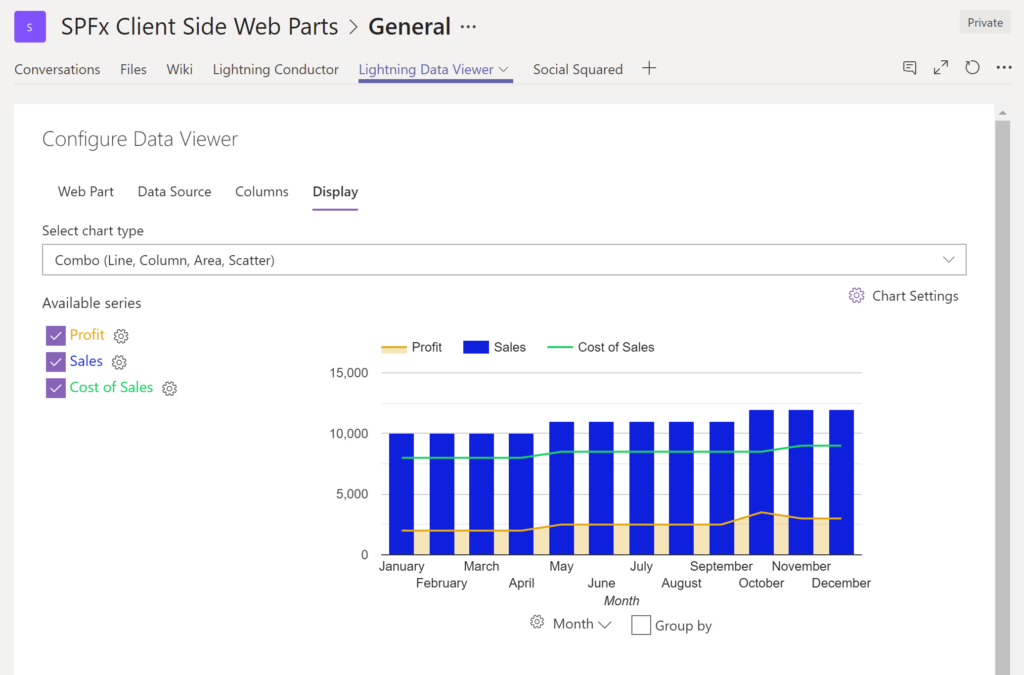
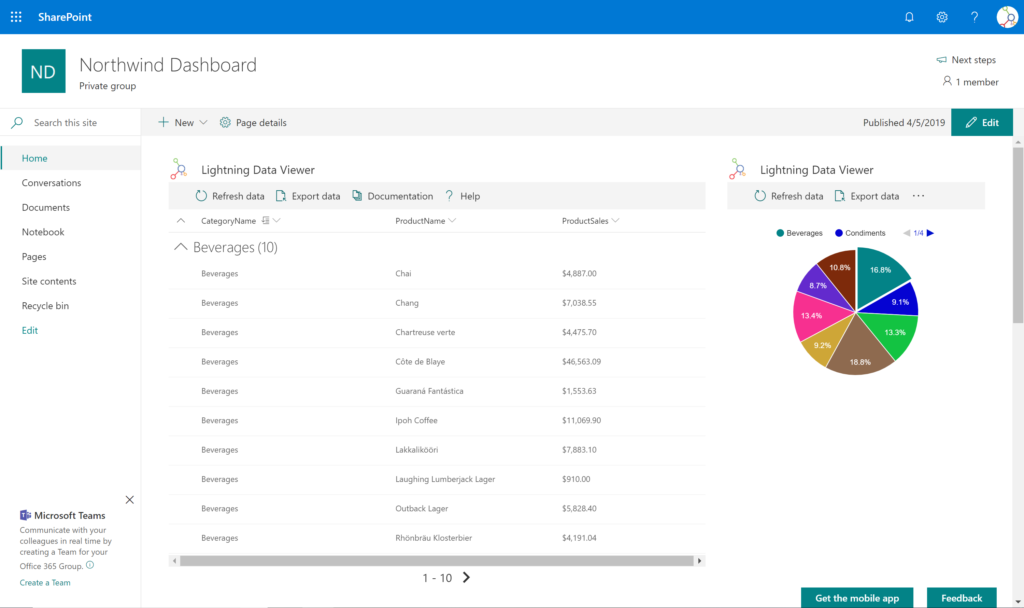
  • Allows selection of layouts and coloring way beyond what other programs do.
  • Easy to learn and very functional.

Cons

  • Data Viewer has a graph feature that is old school flat design. We loved the In House real 3D graph Lightning Tools program.

Return on Investment

  • It allows us to do things that would take a great deal more time to duplicate in SharePoint
  • It cuts down on ugly looking built in SP list layouts
  • Users find it easy to access, thus this product is more productive