


Find the Bad Hop Right Away

Use Cases and Deployment Scope
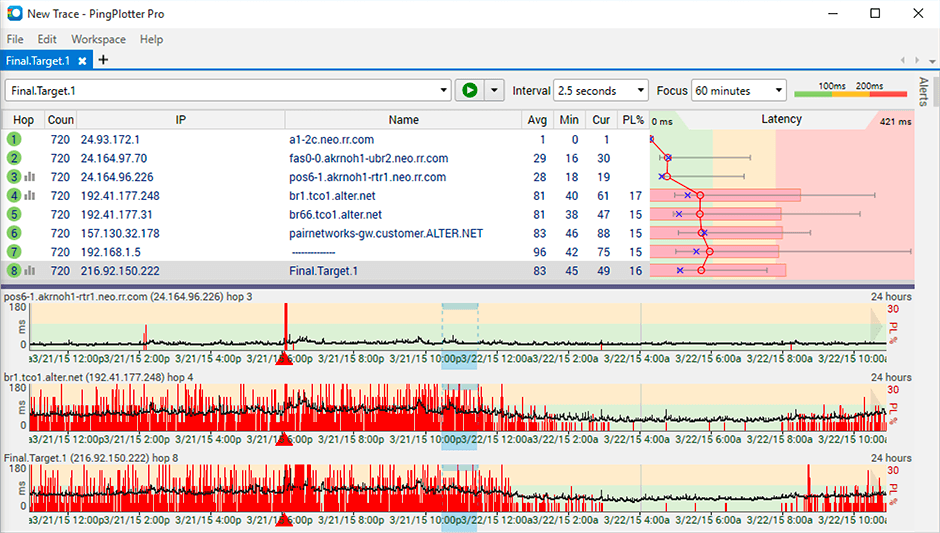
I was having serious problems with my Verizon FIOS and had no good way of seeing what was happening or where the problem was. I have FIOS going to the ONT going to a MOCA cable adaptor going upstairs to the other MOCA adaptor which was going to an Eero and then to my WYZE hub. Yeah I know. But I sure didn't want to diagnose all of that!
So I installed PingPlotter and immediately discovered that all of that was just fine. But Verizon was dropping packets at every hop! I was able to explain this and after they updated some firmware somewhere, I've got my 1G/1G working and I know that internally, my network is solid!
So PingPlotter was fundamental in seeing this in realtime and giving really great tools for outputting it in all the different forms. I'm sure if I had more complicated situations, it would be a necessary tool!
Great tool!
Pros
- Graphing every network hop and tracking the averages and the instantaneous
- Providing export capabilities. No copy/paste or screenshots!
- It just keeps running and tracking for me. Awesome.
Return on Investment
- It allowed me to get back to work instead of worrying about the network. Critical.
Usability
Other Software Used
Beyond Compare, IntelliJ IDEA, Anthropic Claude

