
What is Smart eVision?
Smart eVision Dashboard: Executive Dashboard and IoT Monitoring
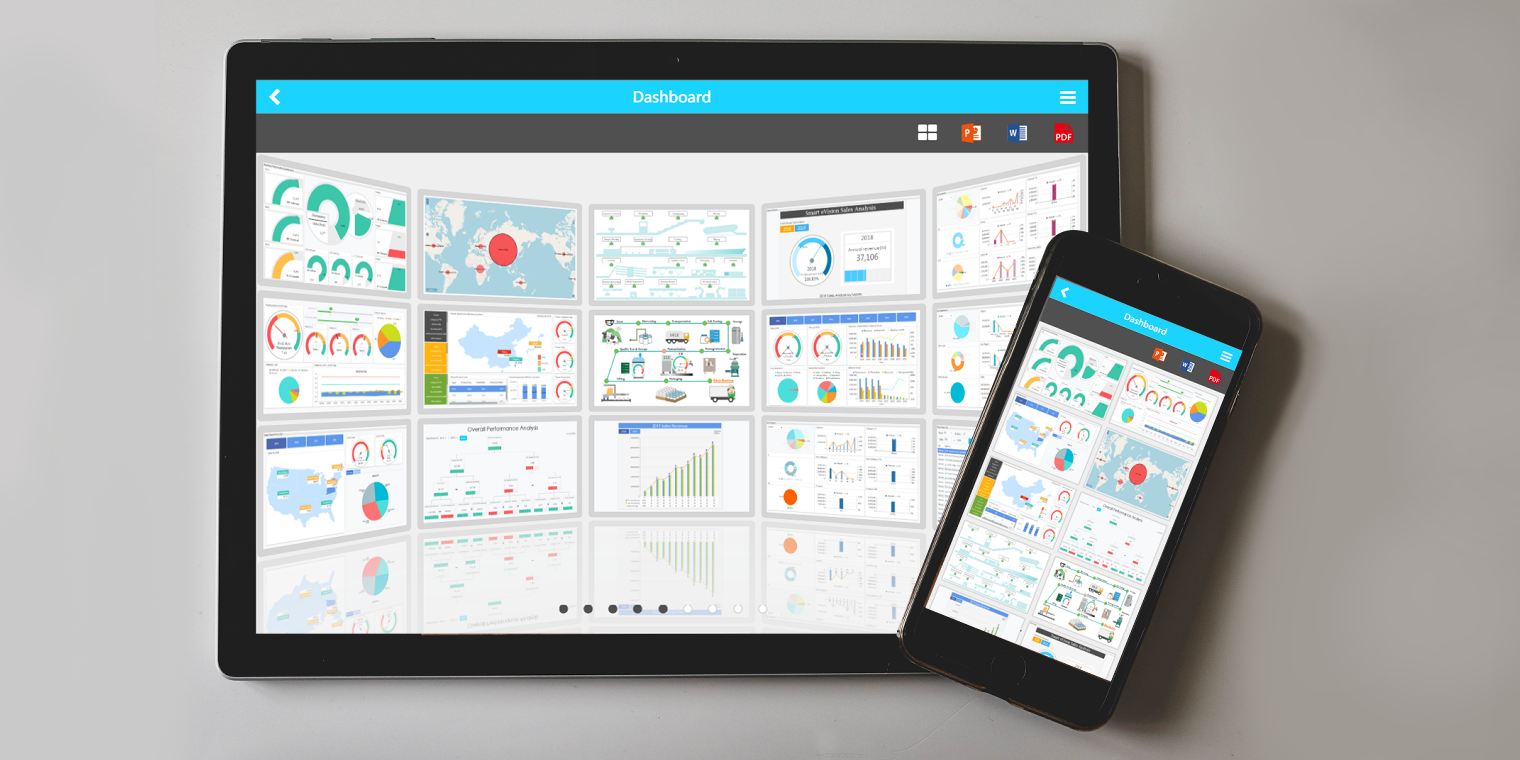
Smart eVision Dashboard provides users with actionable insights from enterprise data. Users can view insights on its dashboard presenter: the Cockpit, which can be exported as interactive PPT files for users to take on the go. Its In-memory Data Warehouse is designed to provides a smooth analyzing experience even for large databases. In monitoring scenarios, Dashboard can connect to real-time data sources and MQTT, then view operational conditions on multiple screens. You can also set mobile alerts to automatically notify related personnel of alarming situations.
Smart eVision Query/Report: Web Querying & Reporting Solution for Enterprises
Smart eVision Query/Report comes with both querying and reporting solutions and accommodates a variety of data sources. With an Excel-like interface, users are able to design with styling and formatting features. Drag, drop and paste to create customizable dynamic queries and reports. Variant embedded components and sophisticated parameters open up more data viewing possibilities; watermarks and version control strengthen data security. Send daily performance reports to managers using its Scheduling module, or export a variety of files for data exchange. Query/Report even provides precise overlay printing for blank shipment orders, checks and more.Categories & Use Cases
Media


1 / 12


