TrustRadius
SolarWinds AppOptics

SolarWinds AppOptics

Overview

What is SolarWinds AppOptics?

SolarWinds AppOptics (formerly Librato) is an IT infrastructure monitoring service and APM, based on technology acquired by SolarWinds with Librato in 2015 to expand its cloud monitoring portfolio.

Read more
Recent Reviews

TrustRadius Insights

1. Lack of Integration with GCP, Oracle, and Service Now: Several users have mentioned that the software does not support integration with …
Continue reading

Review!

8 out of 10
January 18, 2022
Incentivized
This product has [helped] me to do Performance management for my website. I was able to get detailed and real-time statistics of various …
Continue reading

Very Happy

10 out of 10
July 15, 2020
Incentivized
We use it for most of our products. We use it for many things, but to me, the main use is when we do our deployments to monitor for …
Continue reading
Read all reviews

Awards

Products that are considered exceptional by their customers based on a variety of criteria win TrustRadius awards. Learn more about the types of TrustRadius awards to make the best purchase decision. More about TrustRadius Awards

Popular Features

View all 12 features
  • Application monitoring (30)
    8.5
    85%
  • Database monitoring (28)
    7.5
    75%
  • Application performance management console (26)
    7.0
    70%
  • Threshold alerts (26)
    6.3
    63%
Return to navigation

Pricing

View all pricing
N/A
Unavailable

What is SolarWinds AppOptics?

SolarWinds AppOptics (formerly Librato) is an IT infrastructure monitoring service and APM, based on technology acquired by SolarWinds with Librato in 2015 to expand its cloud monitoring portfolio.

Entry-level set up fee?

  • No setup fee
For the latest information on pricing, visithttps://www.appoptics.com/pricing

Offerings

  • Free Trial
  • Free/Freemium Version
  • Premium Consulting/Integration Services

Would you like us to let the vendor know that you want pricing?

2 people also want pricing

Alternatives Pricing

What is IBM Instana?

Instana, an IBM company since the December 2020 acquisition, provides APM services for SOA, microservices, containerized applications and Kubernetes, and cloud native applications, as well as discovery and monitoring for IT assets.

What is ScienceLogic SL1?

ScienceLogic is a system and application monitoring and performance management platform. ScienceLogic collects and aggregates data across and IT ecosystems and contextualizes it for actionable insights with the SL1 product offering.

Return to navigation

Features

Application Performance Management

Application performance management software monitors software to ensure performance and availability

6.8
Avg 7.6
Return to navigation

Product Details

What is SolarWinds AppOptics?

SolarWinds® AppOptics™ is presented by the vendor as a SaaS-based simple, powerful and affordable Infrastructure & Application monitoring for custom on-premises, cloud, and hybrid systems.

  • Full-stack visibility – Monitor the health and performance of custom on-premises and highly distributed cloud applications across services, hosts, containers, and platforms down to the code.

  • Reduce MTTR – Monitoring infrastructure and application metrics side-by-side reduces the time it takes to identify what part of the stack is failing, so you can quickly get to the root cause.

  • Auto-instrumented Root Cause – Quickly pinpoint issues; Automatically presents the most likely cause of a performance problem. Takes the guesswork out of troubleshooting.

  • Simple Setup – Up and running in minutes, easy to use and a minimal learning curve for IT professionals.

  • Integration that matters– Cohesive end to end monitoring that enables maximum observability from metrics, to traces, and down to logs.

  • Align your performance goals with business goals – Incorporate custom metrics to combine business metrics side-by-side with system metrics. See and measure the impact infrastructure and application performance has on your business performance.

  • Highly scalable – Cost-effectively scale as your business scales with analytics and trend reporting, providing you with insights into short- and long-term changes to performance and resource utilization.

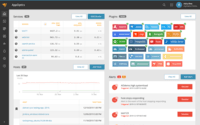
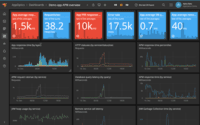
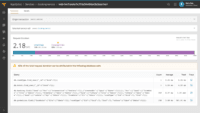
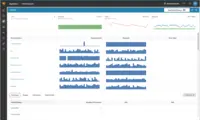
SolarWinds AppOptics Screenshots

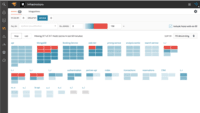
Screenshot of AppOptics Home ScreenScreenshot of AppOptics DashboardScreenshot of AppOptics TracesScreenshot of AppOptics Trace Root CauseScreenshot of AppOptics InfrastructureScreenshot of Host Heat Map

SolarWinds AppOptics Video

Learn more: http://slrwnds.com/AppOpticsApplication AppOptics provides real-time visibility into any application by collecting both high-fidelity metrics and detailed transaction traces. With its distributed tracing functionality, you can follow requests across processes, hos...
 Show More

SolarWinds AppOptics Competitors

SolarWinds AppOptics Technical Details

Deployment TypesSoftware as a Service (SaaS), Cloud, or Web-Based
Operating SystemsUnspecified
Mobile ApplicationNo
Supported Languages.Net, Go, Java, PHP, Python, Scala, Node

Frequently Asked Questions

SolarWinds AppOptics (formerly Librato) is an IT infrastructure monitoring service and APM, based on technology acquired by SolarWinds with Librato in 2015 to expand its cloud monitoring portfolio.

Datadog, New Relic, and Dynatrace are common alternatives for SolarWinds AppOptics.

Reviewers rate Application monitoring highest, with a score of 8.5.

The most common users of SolarWinds AppOptics are from Mid-sized Companies (51-1,000 employees).
Return to navigation

Comparisons

View all alternatives
Return to navigation

Reviews and Ratings

(57)

Attribute Ratings

Reviews

(1-25 of 30)
Companies can't remove reviews or game the system. Here's why
Score 8 out of 10
Vetted Review
Verified User
Incentivized
We used SolarWinds Loggly in our project for application monitoring. So we thought to have SolarWinds AppOptiocs for infra monitoring, so all details are in one place.
  • easy to set up with AWS.
  • UI design is straight forward , make it easy to get up to speed.
  • price is good compare to others (for small to mid-size infra needs).
  • integration with other tools.
  • pricing structure should be more flexible.
I think it works well with AWS. If you are using other SolarWinds products, specially Loggly than this might be a good choice as it would be easy to correlate and makes troubleshooting a bit easy. Pricing is good for small to mid-size infra, just clear it up on how you will use licenses (packs).
Score 8 out of 10
Vetted Review
Verified User
Incentivized
As an early-stage startup, we were looking for a solution that offered the following: Automated alerts Performance monitoring Request tracing Monitor 3rd party services AppOptics provides all of this functionality at a much lower price than its competitors such as NewRelic or Instana. We have been using them for over a year to monitor our application and AWS infrastructure. We have been very satisfied with their product. It has helped us identify various performance issues, resource bottlenecks, and issues with downstream services. In case of issues in our infrastructure or downstream services, it has helped us resolve the issue with low turnaround times. We have given access to this tool to our entire engineering team. Additionally, we have set up automated alerting and configured it to notify us through OpsGenie. UPDATE Dec-2022: It has been 2.5 years since the first review. We are still using AppOptics and we continue to reap the benefits that we have listed above.
  • Request tracing with code profiling.
  • Automated alerting on latency and response codes for each API.
  • Low resource overhead while collecting data from our application servers.
  • Highly performant dashboard that enables us to make progress rapidly.
  • Very resilient. We have not seen a downtime in their service in the entire year that we have used them.
  • Identify database and cache requests that are taking longer than expected
  • Monitoring and alerting for downstream services can be improved significantly.
  • They can make it easier and faster to setup alerts for the infrastructure and application.
With the current set of features, AppOptics is a great option for startups that do not depend on downstream external services for their product. I have already recommended it to some friends working at other startups. I am rating it 8/10 instead of 10/10 because its monitoring of downstream services is inadequate. In our company, we have a monolithic application. So, we don't have an opinion on how it would operate in a service-oriented architecture. Dec 2022: 2.5 years since the first review, I have seen a significant improvement in the monitoring of downstream services. We have leveraged AppOptics to identify requests to Database and Cache with anomalous behaviour. Additionally, they have also made it easier to track the performance of API requests made to external services. Hence, I updated the rating to 9/10. The reason I have not scored it a 10/10 is because setting up alarms can be made easier.
December 14, 2022

Master Player just Born

Nikhil Kumar Sharma | TrustRadius Reviewer
Score 10 out of 10
Vetted Review
Verified User
Incentivized
SolarWinds AppOptics is being analysed to be used as a potential Cloud Services Monitoring tool - and on a side note, also being analysed on how effectively AppOptics can be leveraged to to APM things such as AppDynamics and Dynatrace does. So we are proposing SolarWinds AppOptics to our client as the new technology monitoring tool for cloud infra, primarily.
  • Cloud Service Monitoring
  • New Technologies Monitoring such as Containers Docker
  • APM
  • GCP is not Supported
  • Oracle is not Supported
  • No Integration available with Service Now
SolarWinds AppOptics is a fit tool for monitoring modern technologies such as Cloud Services (AWs, Azure), Micro Services, SaaS solution - which would not require on-premises like attention for Maintenance, Patching etc, and hence no un-necessary downtime since it is being managed by Vendor itself. It also helps in application tracing like an APM tool.
Score 10 out of 10
Vetted Review
Verified User
Incentivized
We currently utilize SolarWinds AppOptics for both infrastructure and application performance monitoring. We mainly use it to see application errors, and locate any issues that cause other than optimal performance in the application. We provide the information gathered from SolarWinds AppOptics to our application support/development/configuration management and database administration teams to take corrective action on what may be causing the errors or other than optimal performance. SolarWinds AppOptics is an affordable solution to monitoring your application's performance.
  • Identifies errors experienced by our end users.
  • Locates application errors.
  • Provides insight into our end users' overall application experience.
  • Allows us to know that our application performance monitoring solutions is in good hands.
  • Not applicable.
  • SolarWinds AppOptics is a solid, affordable product on par with other APMs I've used in the past.
SolarWinds AppOptics provides our Monitoring Team with full visibility into our end users' overall application experience while using our application. Our application is our product provided to our clients, so having the ability to keep a close watch on errors, slow performance, etc. are vital to our company as a whole. It is a great product and quickly identifies areas of need in our application to better assist our technical resources with correcting issues and providing a better product and service to our clients.
Score 8 out of 10
Vetted Review
Verified User
Incentivized
We use AppOptics to monitor performance, error rate, latency, database activity, and remote calls of our applications. We use this to monitor applications running on NodeJS (Express/HAPI), Java servlet, and services running on tomcat. It provides insight into the number of requests per second, errors coming in, and some information about JMX and database parameters. This helps us debug issues, slowness, and unexpected events with ease and speed.
  • Application Monitoring.
  • API monitoring.
  • Bifurcation of time consumed for result.
  • Remote calls monitoring.
  • Database query monitoring.
  • Dashboard.
  • Ease of use.
  • Missing parameters at times.
AppOptics is good for small to medium-sized organizations with less than 150 servers or less than 40 services to monitor. It performs well for this use case where people need to get an overview of application performance, and 95%ile data is okay. Somewhere every data point and every record is critical; it should be avoided.
January 18, 2022

Review!

Score 8 out of 10
Vetted Review
Verified User
Incentivized
This product has [helped] me to do Performance management for my website. I was able to get detailed and real-time statistics of various variables like network packets, user counts, and this really helped us to better track our website. The data was also showcased in an interactive graph which made it easy to use to visualize our stats.
  • Interactive graph
  • None
Very useful for monitoring your application and [tracking] its uptime/downtime. The graph is super interactive and customization as well and the dashboard and be configured to fit your needs. The theme (light and dark modes) will also be an additional welcome bonus!
Score 10 out of 10
Vetted Review
Verified User
Incentivized
I mostly use AppOptics to monitor our website performances, response time, status code, etc. How is the loading time distributed between servers, databases, and caches? Is one of our services spiking for some reason? We use it to focus our attention on pages that need to be optimized to improve the user experience. It also helps us to focus on what needs to be optimized.
  • Monitoring services.
  • Detect service failures.
  • Helps pinpoint problems in our website.
  • The only thing that I would add is the possibility to display every single query our servers receive to eventually analyze them and query through them. We could also generate nice visualizations from that. Right now I believe we can only see averages.
Here is one scenario where AppOptics is well suited: when we deploy a new release. When you work on big projects, it is sometimes hard to evaluate all the impacts that our new release will have on our production environment. AppOptics allows us to monitor very easily the release behavior on production. Another scenario: when we'd like to optimize our website. AppOptics shows us what page is the most used and which one takes the most time to load and how the loading time is distributed between servers, database, and cache. That is very useful to focus our efforts on what's is important for our users.
Score 8 out of 10
Vetted Review
Verified User
Incentivized
We use the APM for a single department so far. It helps us dig into performance degradation events of our java web services.
  • Compares performance to previous day/week.
  • Shows detail of traced requests including DB queries and cache calls.
  • Performs quickly and has little lag time between reported detail.
  • Report filtering could be more powerful.
  • Date comparison options like 4 weeks ago instead of 1 month.
APM over a highly used java service will perform quickly and efficiently.
Score 9 out of 10
Vetted Review
Verified User
Incentivized
SolarWinds AppOptics is one of the successful tools used to closely follow our web applications. A tool that helps us see response times and errors of our web applications. It is used by DevOps team in our company in test, staging, and production web applications. It is a service that we use to monitor healthy working environments and provide information by helping in debugging the bug when we encounter an unusual event.
  • SolarWinds AppOptics has an easy to use and fast interface. Thus, you can use time more efficiently.
  • SolarWinds AppOptics has as many details as you want. So you only display deep details when you want.
  • SolarWinds AppOptics already has many plugins. So you can easily connect with your other services.
  • The number of plugins should be increased.
  • The number of warning methods should be increased.
If you have a web application and present it to others using remote servers, all the scenarios you have are eligible to use SolarWinds AppOptics. But there are of course some conditions. For example, to speak for SolarWinds AppOptics APM, the language you use in your web application will affect whether you use the SolarWinds AppOptics APM service.
Score 8 out of 10
Vetted Review
Verified User
Incentivized
It is used by the IT department to monitor the performance of our web applications and help track down bottlenecks and inefficiencies.
  • The time frame options help track peak hours and compare impact of improvements.
  • The detailed breakdown of traces requests helps track down the source of slowness in applications.
  • The database queries tracked help find most used tables and help decide where indexing is needed.
  • The exceptions graph on the overview screen can be misleading as not all exceptions are high priority.
  • Could use more customization on the overview screen. Would like to change what graphs are shown for each service.
AppOptics is great for monitoring how your service is performing, and can help with finding where you can speed it up.
Score 7 out of 10
Vetted Review
Verified User
Incentivized
Using AppOptics for Application Performance Monitoring and helping to optimize for better performance.
  • Application Performance Monitoring.
  • DB Monitoring.
  • Network Monitoring.
  • API level check.
  • Running application box stats.
  • Consumed memory stats.
Well suited for on-cloud running application and can find out multiple performance monitoring stats.
July 15, 2020

Very Happy

Score 10 out of 10
Vetted Review
Verified User
Incentivized
We use it for most of our products. We use it for many things, but to me, the main use is when we do our deployments to monitor for changes in performance. We have also been able to see what part of the applications/stack is slow so that we can further improve things.
  • Shows each layer of application.
  • Code tracing.
  • Easy to visualize where the issues are.
I think it's useful for any and all applications.
Score 9 out of 10
Vetted Review
Verified User
Incentivized
I use SolarWinds AppOptics to gather high-level information on bottlenecks and quickly drill down into problematic requests and identify things I can fix.
  • Aggregate info to show problems
  • Show layer by layer overview of where time is spent
  • Might be related to our setup but correlating info between different apps is not possible.
I love the ease with which SolarWinds AppOptics allows me to get information about our web services.
Score 9 out of 10
Vetted Review
Verified User
Incentivized
We are using SolarWinds AppOptics for application monitoring. Compared to other monitoring tools, AppOptics' GUI is the most simple and any layman can understand the functionality of it. Latency monitoring between the application or the components is easy. Integration with the application is also easy.
  • Best GUI.
  • Detailed view of latencies.
  • Application integration is easy.
If you are using microservice architecture in your company to monitor microservices, AppOptics will be useful to monitor the latencies between the applications and other services.
Score 10 out of 10
Vetted Review
Verified User
Incentivized
We use AppOptics for our application monitoring across the whole infrastructure. AppOptics provides a very deep-dive and point to point metrics and alerts for the various microservices which help to track and identify various issues which may/could cause the instability in our application flow. So if I need to check my latency stats from one microservice to another, and if latency rate is higher than usual, we can easily trace the number of facts with the help of AppOptics like:
1) Current response code from the API.
2) Number of DB connections.
3) Queries requested from app to DB.
4) Queries that track latency.
5) Failing APIs.
  • Easy to integrate with an application stack. Supports many. In my case, I just need the AppOptics client and client key to start integration with my application stack.
  • Provide real-time metrics like DB connection, query analysis, latency in API calls and other connections, response codes for various API's, etc.
  • We can also set thresholds based on use-cases and set up the alerts and publish one across various suitable channels.
  • It would be good if could get some sort of dynamic report generation functionality base on historical trends. The rest is good.
As I already mentioned in the use case section, AppOptics provides a very deep-dive and point to point metrics and alerts for the various microservices which help to track and identify various issues which may/could cause the instability in our application flow. So if I need to check my latency stats from one microservice to another, and if latency rate is higher than usual, we can easily trace the number of facts with the help of AppOptics like:
1) Current response code from the API.
2) Number of DB connections.
3) Queries requested from app to DB.
4) Queries that track latency.
5) Failing APIs.

May 16, 2020

AppOptics Review

Score 9 out of 10
Vetted Review
Verified User
Incentivized
It is used in multiple departments of our organization. It is being used to control response time, error rate, and drill down into multiple paths of the website and 95th percentile.
  • Markers: Drill down into specific logical blocks of the execution timeline.
  • Remote services: Possibility to track external API calls separately from the main stack.
  • Alerting: Possibility to receive alerts as soon as a certain threshold was reached.
  • Get to the errors from the dashboard graphs.
  • Custom-selected Nth percentile.
  • Auto-refresh option for close to live-monitoring.
I like to have it open with the last 60 minutes of data, especially during our deployments to monitor changes in the load of the website infrastructure. The only annoying thing is that I have to constantly refresh it myself to see the change.
Score 9 out of 10
Vetted Review
Verified User
Incentivized
It's being used by the department to detect performance issues like response time in the application. This helps us detect the bottlenecks in our application. This includes remote calls, database queries, cache calls. It also helps us determine the different layers in a request made. This helps in identifying ones that can be removed.
  • Average response time.
  • Average request rate.
  • Tracing different layers in a request.
  • Detection of slow queries.
  • More data can be added, however, it could also be that we haven't set it up fully.
It is best for the detection of bottle necks in the application. It gives an idea of the different layers the application spends time in. The average response time and request rate give us a rough idea of what we are doing. Transaction details help in determining finer points in the application. It could do better with a lot of server performance stats as well. Maybe we need to set it up.
Score 9 out of 10
Vetted Review
Verified User
Incentivized
We have been using SolarWinds AppOptics for a while. Its agent is monitoring all of our servers we run in Amazone and in Azure cloud. It is very useful when combining the dashboards and for alerting. The only thing we miss is SMS support for alerts. Also when on the Infrastructure page I notice I could find useful like "merge" function. So I can select a couple of instances and see Host details for those selected.
  • Compact monitoring
  • Tracking of transactions, requests, etc.
  • Its simplicity of usage. Less is more.
  • Its SMS gateway for notification, so we don't need to use a third party.
  • On Infrastructure page, select multiple choices and see Host details for all of them
  • Better organization of metrics
If your application requires detailed monitoring, alerting, and metrics all of kind, SolarWinds AppOptics would be a great fit for your organization. I have been using multiple APM tools but SolarWinds AppOptics is the best one so far.
Dave Costantino | TrustRadius Reviewer
Score 10 out of 10
Vetted Review
Verified User
Incentivized
We use SolarWinds AppOptics to monitor infrastructure running in our production SaaS environment running on AWS. It is used by the entire engineering team. If a system fails or is exhibiting performance problems, we are alerted nearly instantly and can respond before our customers even notice there is an issue.
  • Simple installation and configuration
  • Easy to use UI
  • Good value
  • Many integrations with third-party software
  • Better cluster support: identify and group all related hosts automatically based on name
SolarWinds AppOptics is well suited for monitoring an environment with a diverse set of infrastructure, due to its wide variety of integrations supporting third party software and services. It is especially suitable for cloud environments (AWS, Google Cloud, etc.) where infrastructure is more dynamic in nature.
Score 8 out of 10
Vetted Review
Verified User
Incentivized
We use SolarWinds AppOptics in one project. We are providing engineering services to one US-based organization and we have integrated SolarWinds AppOptics in their application for performance monitoring. AppOptics helps us to create monitoring dashboards and configure alerts if some operation crosses the threshold response time to meet SLAs. Our project is based on the healthcare domain so real-time data is very important for this and AppOptics is useful to track database response time, communication time between two services, etc.
  • Provides default dashboards for all your services and we can create custom dashboards as well
  • We can configure alerts on API response times and can configure multiple notification channels
  • It tracks everything including infrastructure, database response, communication between different micro-services
  • Sometimes I have faced issues while creating custom dashboards
  • A few metrics do not provide accurate results
  • Documentation can be improved
SolarWinds AppOptics is a great tool to monitor the health and performance of micro-services. Nowadays, every big organization is using distributed architecture, and application monitoring is an essential part of that. So SolarWinds AppOptics is providing almost every feature which is required to monitor a large distributed system.
Score 7 out of 10
Vetted Review
Verified User
Incentivized
SolarWinds AppOptics is being used to help engineers debug issues within the entire application stack, from the API call all the way down to the actual database. It's a very powerful tool to isolate latency and reliability issues that you can't typically find in logs or metrics, unless you make those very granular.
  • Full application stack trace
  • Measuring latency
  • Providing historical map of calls
  • It's confusing sometimes to dig into a trace, like certain levels don't have much info. AppOptics just says this level occupies 95% of the call time.
  • It would be nice to have AppOptics identify if the root cause of an issue was caused by a dependency, e.g. another service it calls. It would be great to chain them together.
  • Not very intuitive, if you don't know what you're doing or know what to look for.
SolarWinds AppOptics is a great tool if you want to debug latency or go deep into a specific endpoint to investigate the full stack call. However, when looking at the overall health of your service and its dependencies, it won't give you the overview you're looking for. We use SignalFx to provide us with the view of the "forest" and SolarWinds AppOptics to provide us a view of a "tree." It would be great if AppOptics suited both situations, so you didn't have to switch between tools.
Greg Smethells | TrustRadius Reviewer
Score 8 out of 10
Vetted Review
Verified User
Incentivized
It is used by both DevOps and by Tech Support. We use it to track down source code-level issues and to monitor response time and service level stats.
  • Distributed tracing.
  • Basic hardware monitoring.
  • Application transaction stats/details.
  • Support for celery in Python.
  • Overall better Python support.
  • Backwards compatibility.
Any web app that needs distributed tracing and transaction monitoring is well suited for this product. Python support for Gunicorn is good. Python support for celery tasks has been broken for some time. Releases of the Python language binding are infrequent. There is no GitLab or GitHub project to submit tickets to which would help with issue tracking for users.
Score 9 out of 10
Vetted Review
Verified User
Incentivized
SolarWinds AppOptics is solving various APM issues for our microservices production environment.
As our infra is very huge so we haven't implemented it in the whole organization. But still, we are using it for most of the critical services. Pinpointing the issues becomes very easy during production downtimes.
  • Alerting
  • Trace debugging
  • Remote calls detection
  • flexibility of configuration
  • Linked graph of microservices can be included
SolarWinds AppOptics is very well suited for all kinds of APM needs like transaction tracing, remote calls, request status codes, stack trace debugging. It is less appropriate for a need like central logging solution.
Score 7 out of 10
Vetted Review
Verified User
Incentivized
AppOptics is used to help maintain the availability, efficiency and functionality of our public facing web applications and APIs - these are business critical platforms upon which internal customers, clients and suppliers all rely. AppOptics is an invaluable tool in diagnosing problems at an early stage, and gives our development team deep insight into the context of problems as they arise, as well as providing proactive monitoring of resource usage and error rates across multiple endpoints.
  • Deep insight into the ASP.NET pipeline, allowing drill-down into individual requests.
  • Intuitive dashboards with the ability to slice by time give a good overview of real-world endpoint performance.
  • Ability to drill into individual queries executed during the lifetime of an IIS request provide excellent intelligence for targeted optimization of SQL bottlenecks.
  • Extending visualization into the asp.net processing pipeline would be really helpful - the ability to see which handler/piece of middleware did what, and when would be great.
  • The ability to capture parameters for certain SQL queries - possibly based on a filter.
  • The ability to describe the relationship between requests and users - so being able to see all requests submitted in a particular session (by cookie, http header value, etc) would be most useful.
In our experience, AppOptics is most suited to ASP.NET Applications or APIs running on IIS, using SQL Server as a persistence layer. AppOptics gives a good visualization of each request, and crucially how that individual request interacted with SQL Server. This enables to us monitor the effectiveness of our in-app caching as well as the impact of cache misses on performance and responsiveness of our apps. In addition, capturing of exceptions is detailed and intuitive, providing mostly complete stack traces where problems occur. This is invaluable to our development team, who can use the wealth of information provided about a problematic request to in many cases reproduce the issue without having to seek additional information from the customer. This expedites the fact-finding portion of our support activity, leading to more timely fixes being deployed to production.
Score 9 out of 10
Vetted Review
Verified User
Incentivized
  • Monitoring infrastructure in production. We also use it to track AWS usage and its APM capabilities.
  • Whenever there's an exception or slow performance in production we use AppOptics.
  • Drilldown to slow transactions in DB or server-side code.
  • General visibility of usage vs. spending on AWS.
  • Quick view to usage statistics in AWS, instead of going to CloudWatch (for example, SNS messages).
  • Easy to integrate.
  • No need to instrument code.
  • Full visibility.
  • Better python instrumentation.
  • Monitoring AWS lambda.
Great for monitoring infrastructure and APM + DB.
Return to navigation