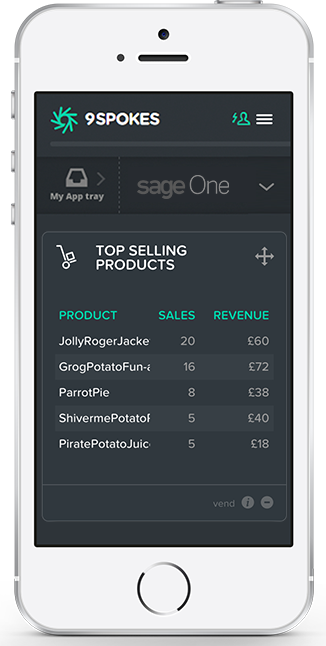
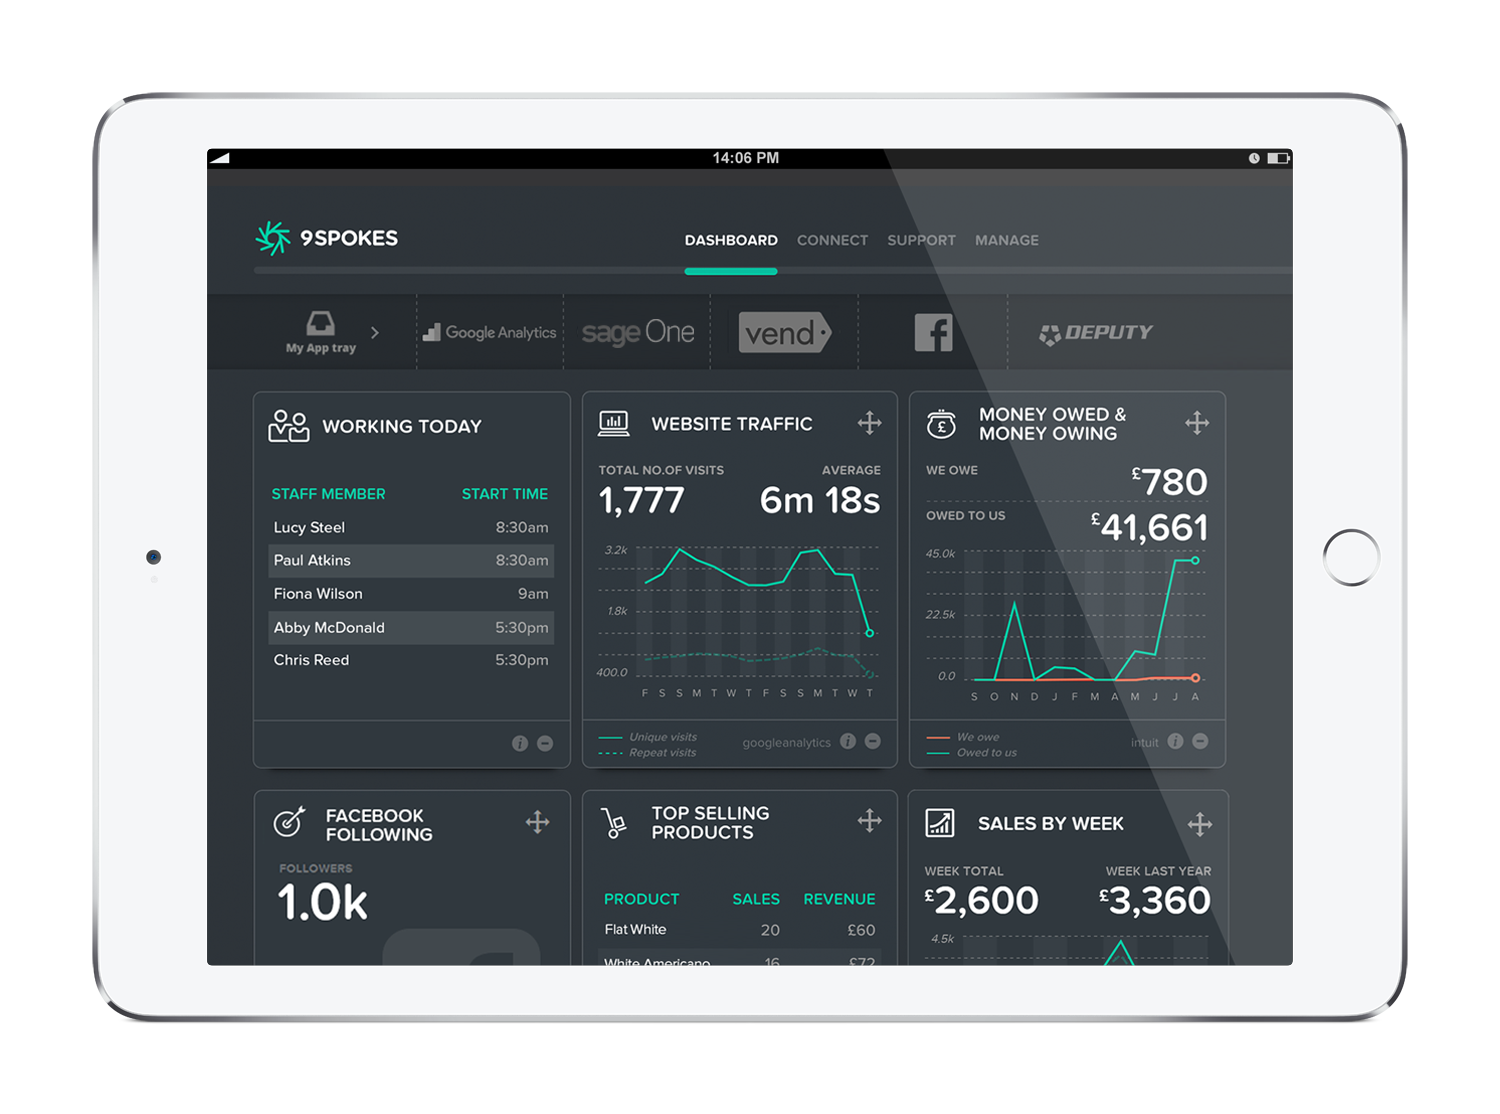
9 Spokes is a smart dashboard that is designed to help companies see their business more clearly. Key metrics across essential areas of the user’s business are displayed in one place, revealing exactly how it's performing. The vendor’s value proposition is that 9 Spokes makes it easier for companies to make the right calls to manage or grow their business.
According to the vendor, key benefits for SMEs include:
One smart dashboard for your cloud business apps…
N/A
Google Charts
Score 8.2 out of 10
N/A
Google Charts provides a way to visualize data on your website - for free. From simple line charts to complex hierarchical tree maps, the chart gallery provides a large number of ready-to-use chart types. The most common way to use Google Charts is with simple JavaScript that you embed in your web page.
N/A
Pricing
9 Spokes
Google Charts
Editions & Modules
No answers on this topic
No answers on this topic
Offerings
Pricing Offerings
9 Spokes
Google Charts
Free Trial
Yes
No
Free/Freemium Version
Yes
Yes
Premium Consulting/Integration Services
No
No
Entry-level Setup Fee
No setup fee
No setup fee
Additional Details
9 Spokes is free to use - that’s joining, using the smart dashboard and connecting your apps to it. You'll only pay for any new apps you decide to purchase, but you can trial most of the app recommendations for free! If you want to purchase an app, we'll direct you to the app's website so you can sign up with them. If you sign up to a plan, you'll pay the apps directly and then you can connect the app to your dashboard.
—
More Pricing Information
Community Pulse
9 Spokes
Google Charts
Considered Both Products
9 Spokes
Verified User
Anonymous
Chose 9 Spokes
I actually chose QuickBooks (currently using) and Method (used for a month) before deciding that 9 Spokes is just good for looking at a few apps in one place. I'll keep checking back with them to see if they have improved. I wouldn't be surprised if 9 Spokes improves their …
In comparison to Microsoft Power BI, Google Charts has more ease of use for businesses who simply need a way to visually display their data from their reports. Although Power BI may be more robust in more complicated data compilation, Google Charts can still be able to do some …
As our company heavily utilizes Google products, when we first looked into the tool to help us to present our data, we were looking if we could find anything that is from Google and can satisfy our basic needs. Google Charts fit in it very well. That does not mean we are not …
Google Charts is free so it was a no brainer for our company to use. There may be other products out there that have more functionality or are easy, but they are not free.
Google Charts is great because it is free. There are not really other options that are out there that offer as much as Google Charts does without the cost, so no other software really stacks up.
I also would like to add Chart.js to the list, although it was not a searchable option. Google Charts is hard to beat, considering how effective it is, and that there's no need for an enterprise subscription. It's got basically any sort of chart or timeline or trend tracker you …
It is a reliable tool and its free version definitely stacks up against a lot of other paid versions of other software. So if you are using anything else, it is definitely worth checking out Google Charts.
Google Charts is better than any other alternative because it is free. It is a bit difficult to customize, so there may be better softwares out there depending on the complexity of what you are trying to do.
Google Charts does offer a lot of functionality and it is also free which is why it is a great choice for our team. We are always looking for free solutions that are out there.
Smartsheet integrates better with JIRA out of the box so we primarily use Smartsheet for visualisation of our Sprint breakdown. However, when reporting to higher-ups, we use Google Charts as the flexibility is far greater. We can better make visualisations that suite our …
Our teams were already using Google's G suite and as google charts simply came tagged along with it, they were more than happy to go with google charts given its capabilities. Though we have another BI solution in place but teams mostly work with google charts and export their …
Google Charts stacks up better since it is free and does not have the constant pressure for cost overruns, add-ons, annual maintenance and implementation services. The speed of using Google Charts is quick, saving users potentially weeks in getting up and going. For the …
Chart.js is another javascript alternative to Google Charts. It outputs charts in Canvas elements rather than SVG, so it's a bit easier to manipulate and make responsive.
I honestly have no used others. This was my first in my field. But I can say it's been a joy to work with and I don't see myself or my organization using any other platform or program.
I've used D3.js and Google Charts, in my opinion, is easier to use and more accessible. But D3.js is much more visually flexible and has a lot of different use cases if we compare it to this service. So I think Google Charts is suitable for dashboards and applications that …
I have not used many other software similar to Google Charts because a lot of the software I have used in the past has integrated reporting available to the customer. However, for instances where our software reporting is not accurate, we are able to use this online source to …
I definitely prefer Google Charts over Piktochart chart because of the way that it integrates with Google Sheets, Google Drive, and Google Docs. The entire G Suite is completely crucial to our operation and having an outside chart program doesn't streamline or make data …
Good for letting your investors, employees and others know at a glance how your company is doing. The interface is clean and organized well. I just wish more of the app's functionality was available for testing and implementation. "Coming soon" is not really encouraging when we already have been waiting for a year or more.
Google Charts is perfectly suited for most presentations that are data oriented. There's not much of a limit on the type of table or chart you can create, and being able to integrate with Google Sheets just makes things even easier if you've already got the data stored somewhere. It works well on desktop browsers, Iphones, and Android phones. The only drawback I've been able to find is for those that prefer to have a desktop application.
I would like a couple more introductory videos or a live chat option for when you run into an issue. I think this is a Google-wide problem, not only linked to Google Charts.
I have run into some issues with the Dynamic Data but also admittedly could potentially dive in deeper and investigate.
It would be great if Google Charts made it possible to integrate Google Chat into the platform.
Google Charts is a good product. It's widely supported with deep documentation and a large community. But for me, it wasn't customizable enough. When we started with simple charts, it was great, but as we got deeper and more complex, our needs outgrew the library. If I was going forward, I would choose a more barebones library with more freedom and extensibility.
Requires knowledge of Javascript, which can be difficult for a beginner. A business analyst often isn't as technically minded as a developer so collaboration is often required to produce a correct chart for the purpose required. However, the customisation capable due to this creates much better looking charts compared to other tools.
Support was helpful in the beginning but no longer needed because I didn't use the software as much. The experience that I did have with support was very friendly but not enough to give a good review. If the support team was called for initial setup, video chat or messenger app was used.
Google Charts has a very good documentation that we can just go in there and find the stuff we need to implement our solutions on Google Charts. Plus, if we get stuck, we can also email the support and they are very responsive. So overall, the support is very satisfying.
I actually chose QuickBooks (currently using) and Method (used for a month) before deciding that 9 Spokes is just good for looking at a few apps in one place. I'll keep checking back with them to see if they have improved. I wouldn't be surprised if 9 Spokes improves their product within the next 6-12 months.
In comparison to Microsoft Power BI, Google Charts has more ease of use for businesses who simply need a way to visually display their data from their reports. Although Power BI may be more robust in more complicated data compilation, Google Charts can still be able to do some of the basics that Power BI delivers.