Amazon CloudWatch is a native AWS monitoring tool for AWS programs. It provides data collection and resource monitoring capabilities.
$0
per canary run
Jixee
Score 8.9 out of 10
N/A
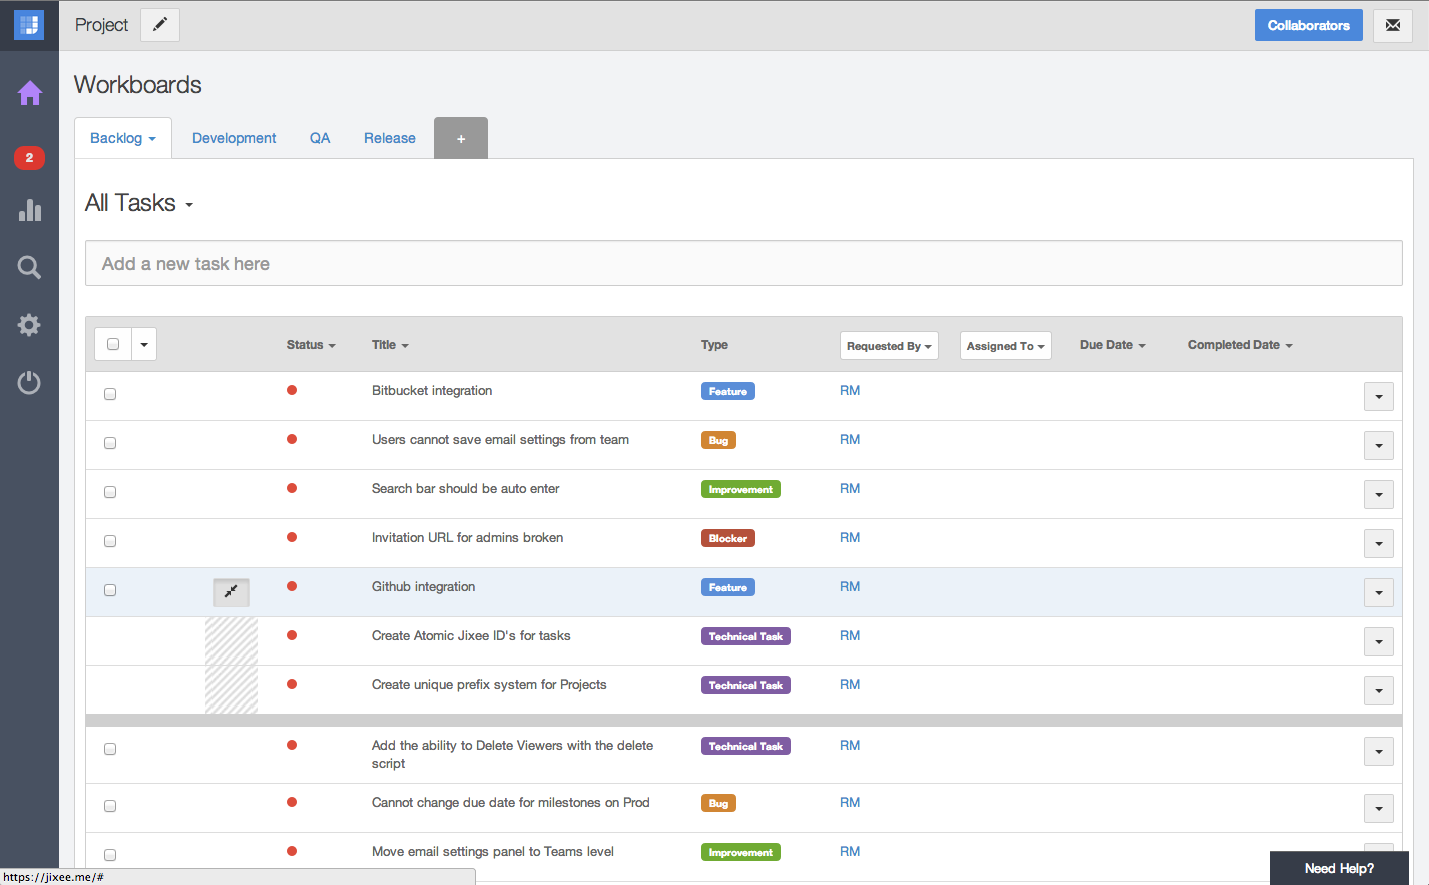
Jixee is a bug and issue tracker that integrates with tools like Github, Bitbucket, and Slack.
N/A
Retrace
Score 8.0 out of 10
N/A
Retrace (formerly APM+) is a lightweight Application Performance Management solution. Retrace gives developers continuous, real-time analysis through a combination of code-level visibility with in-line log and error data. Retrace helps identify top performance offenders by analyzing top page requests, top SQL queries, and top external web services.
$99
up to 3 servers, 500,000 traces, and 1,000,000 logs
Pricing
Amazon CloudWatch
Jixee
Retrace
Editions & Modules
Canaries
$0.0012
per canary run
Logs - Analyze (Logs Insights queries)
$0.005
per GB of data scanned
Over 1,000,000 Metrics
$0.02
per month
Contributor Insights - Matched Log Events
$0.02
per month per one million log events that match the rule
Logs - Store (Archival)
$0.03
per GB
Next 750,000 Metrics
$0.05
per month
Next 240,000 Metrics
$0.10
per month
Alarm - Standard Resolution (60 Sec)
$0.10
per month per alarm metric
First 10,000 Metrics
$0.30
per month
Alarm - High Resolution (10 Sec)
$0.30
per month per alarm metric
Alarm - Composite
$0.50
per month per alarm
Logs - Collect (Data Ingestion)
$0.50
per GB
Contributor Insights
$0.50
per month per rule
Events - Custom
$1.00
per million events
Events - Cross-account
$1.00
per million events
CloudWatch RUM
$1
per 100k events
Dashboard
$3.00
per month per dashboard
CloudWatch Evidently - Events
$5
per 1 million events
CloudWatch Evidently - Analysis Units
$7.50
per 1 million analysis units
No answers on this topic
Essentials
$99
up to 3 servers, 500,000 traces, and 1,000,000 logs
Standard
249+
2,000,000+ traces and 5,000,000+ logs
Enterprise
Custom
Customer number of traces and logs
Offerings
Pricing Offerings
Amazon CloudWatch
Jixee
Retrace
Free Trial
Yes
Yes
Yes
Free/Freemium Version
Yes
No
No
Premium Consulting/Integration Services
Yes
No
No
Entry-level Setup Fee
No setup fee
No setup fee
No setup fee
Additional Details
With Amazon CloudWatch, there is no up-front commitment or minimum fee; you simply pay for what you use. You will be charged at the end of the month for your usage.
For out business we find that AWS Cloudwatch is good at providing real-time metrics for monitoring and analysing the performance and usage of our platform by customers. It is possible to create custom metrics from log events, such people adding items to a basket, checking out or abandoning their orders.
Jixee is particularly useful when it comes to automating the creation, updating, and completion of development project tasks. Jixee facilitates cross-platform collaboration by integrating with services currently used by development teams. Jixee has the ability to interact with chat apps, allowing teams to stay in touch.
If I need to change a logo design on the invoice, the new logo is slightly larger or smaller so the type below the logo is in a different area than before. In this case, you would need to load the new version of the document into APM Plus and redo the mapping of the field areas to properly grab the information needed to process the document. Without doing this, the document could fail or go to the wrong archive based on the fields.
It provides lot many out of the box dashboard to observe the health and usage of your cloud deployments. Few examples are CPU usage, Disk read/write, Network in/out etc.
It is possible to stream CloudWatch log data to Amazon Elasticsearch to process them almost real time.
If you have setup your code pipeline and wants to see the status, CloudWatch really helps. It can trigger lambda function when certain cloudWatch event happens and lambda can store the data to S3 or Athena which Quicksight can represent.
Memory metrics on EC2 are not available on CloudWatch. Depending on workloads if we need visibility on memory metrics we use Solarwinds Orion with the agent installed. For scalable workloads, this involves customization of images being used.
Visualization out of the box. But this can easily be addressed with other solutions such as Grafana.
By design, this is only used for AWS workloads so depending on your environment cannot be used as an all in one solution for your monitoring.
The price can be a bit steep. Although you can use it totally free for 7 days to try it out and see if it is useful for your company.
The payment is per user, which would generate a higher cost to companies with a large number of employees. Although if you join a plan and lower the number of users, the price of the plan is automatically updated.
This is a cloud-based software, so it cannot work without an internet connection.
To set up the fields that APM Plus monitors, you need to map each field area on each document.
APM Plus could use a way to link the documents back into the finance or business software so you can find the document under the PO, Sales Order, Invoice, etc.
APM Plus setup is only for the professionals. There are many areas that need tweaking on setup, having a better default setup would lessen the learning curve to set it up for use.
It's excellent at collecting logs. It's easy to set up. The viewing & querying part could be much better, though. The query syntax takes some time to get used to, & the examples are not helpful. Also, while being great, Log Insights requires manual picking of log streams to query across every time.
Support is effective, and we were able to get any problems that we couldn't get solved through community discussion forums solved for us by the AWS support team. For example, we were assisted in one instance where we were not sure about the best metrics to use in order to optimize an auto-scaling group on EC2. The support team was able to look at our metrics and give a useful recommendation on which metrics to use.
Grafana is definitely a lot better and flexible in comparison with Amazon CloudWatch for visualisation, as it offers much more options and is versatile. VictoriaMetrics and Prometheus are time-series databases which can do almost everything cloudwatch can do in a better and cheaper way. Integrating Grafana with them will make it more capable Elasticsearch for log retention and querying will surpass cloudwatch log monitoring in both performance and speed
1. Jixee is always better in terms of handling task management issue. 2. Overall focus is always on agile development. 3. Design templates are very exciting. 4. onboarding tutorial sessions for beginners. 5. accelerates team communication. 6. Real time chat module. 6. No toggle between multiple windows to reference a task.
It is a very impressive tool which doesn't overwhelm you with unnecessary data. They have combination of tools that haven't seen by any other company which makes it a very powerful tool
APM Plus has freed up users from having to manually attach documents to each place they are sending it. APM Plus will do it automatically.
APM Plus provides a searchable archive to re-visit sent documents with customers and vendors. Having to reprint a document you risk the potential that something has changed since it was last printed.
APM Plus does need IT staff for adjustments and to review sending problems. Not for an average user.