Baremetrics headquartered in San Francisco provides metrics, forecasting, analytics, insights and engagement tools for teams using Stripe, Braintree, Chargify, Recurly, that provides business metrics like MRR, LTV, and subscription Churn.
N/A
ChartMogul
Score 8.1 out of 10
N/A
German company ChartMogul offers their subscription analytics and revenue recognition application to companies relying on their subscriber base. The application integrates with a number of popular subscription billing services (Stripe, Braintree, Recurly, etc.).
N/A
Panorama Necto
Score 8.0 out of 10
N/A
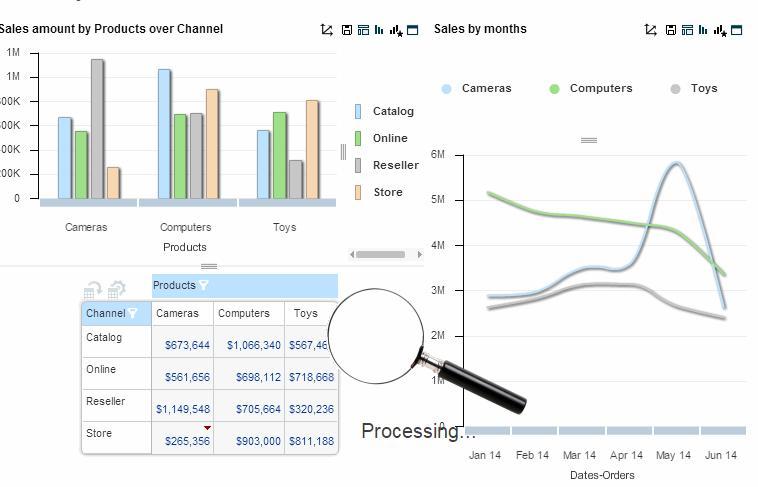
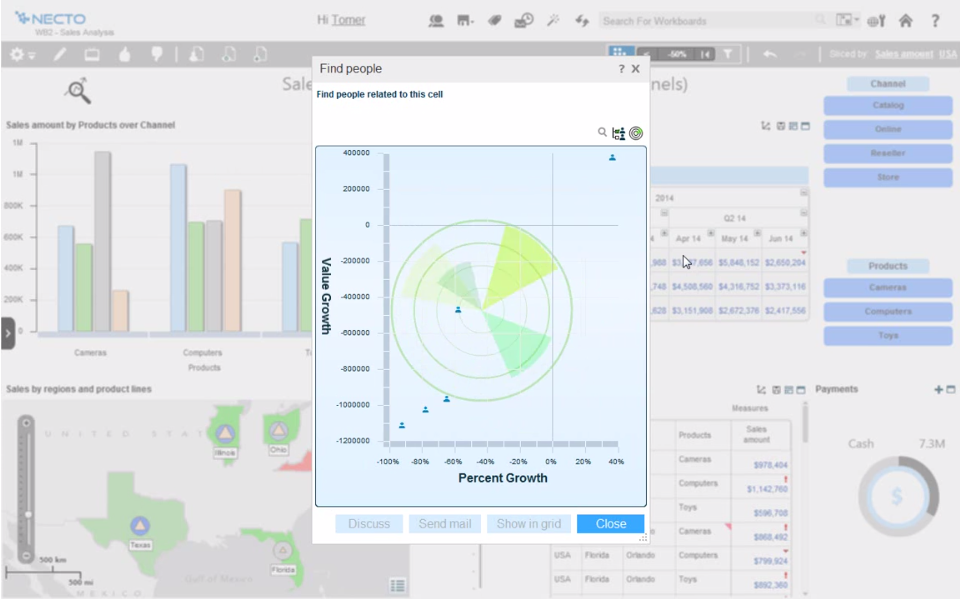
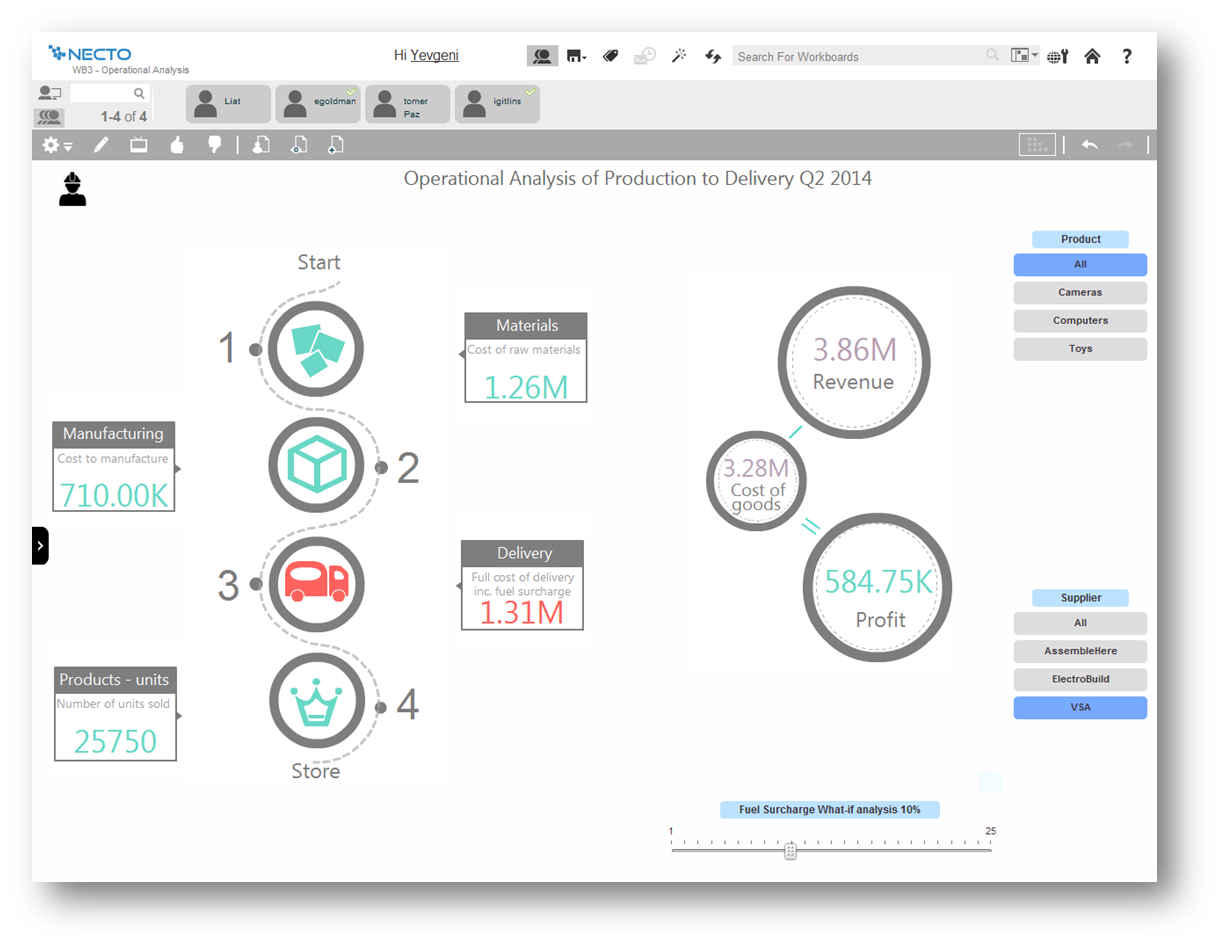
Panorama Necto is a business intelligence solution that provides enterprises with new ways to collaborate and create unique contextual connections. Some key features include: Workboards/Dashboards, Advanced Analytics, and Contextual Discovery.
ChartMogul felt like the market leader for SaaS. Its ease-of-use, visual reporting, and overall feature set seemed to align with exactly what we needed. It provides everything needed when it comes to tracking our revenue month-over-month.
For businesses that rely on subscription/recurring revenue models, especially within SaaS. Once everything is all plugged in, it's so easy to generate granular reports and insights. Straight-up eCommerce businesses that don't rely on a recurring/subscription model might not get as much value.
Panorama Necto 14 is well suited where BI is built to support social collaboration so that its analytics features can be shared to improve decision making by incorporating various organizational input. Additionally it supports an infographic display for information review which is unlike most of its competitors.
Data Ingestion - Because we use a payment processor that ChartMogul understands, they are able to ingest the data automatically and process it with almost no input from us.
Analysis and Insights - Once we got our data into ChartMogul, we immediately started seeing some patterns in our data that hadn't previously been apparent to us.
Customizability - ChartMogul makes it fairly easy to customize and extend the dashboard (and to enrich our data manually via the API).
Comes with lot of option to modify and build the smart infographic. Uses innovative pictures and charts to create the dashboards
Helps you identify why you are succeeding and where you should shift your focus to.
The maps are amazing and they just don’t act as control points rather you can populate various measures on them making it really efficient to understand the business in geographical info graph
This tool is relatively new to the current competitive BI market. Many organizations or business analyst are not yet aware of it's eye catching features.
Need more enhancement for predictive analysis.
Publishing reports as email attachment and mail server configuration is a little complicated process.
Some features are very basic and sometimes you can't add your own SQL query for custom reports. For Macs and Blackberry users this application is not helpful. Non-languages are not supported in info-graphics. They need to improve their forecast analysis. Report sharing is limited among the portal users only
It provides all the features that are required and some that are not the basic requirements, but they represent a great additional capabilities, not available within the similar products
ChartMogul felt like the market leader for SaaS. Its ease-of-use, visual reporting, and overall feature set seemed to align with exactly what we needed. It provides everything needed when it comes to tracking our revenue month-over-month.
This is the next generation BI tool, which will be very helpful for small and medium businesses to kick start data exploration and visualization of their diverse databases, with less intervention from IT. This tool is more end user centric and gives way more power to the end user to perform data analysis